 +7 (499) 444-11-26 +7 (499) 444-11-26 |
Реализация инвестиционных проектов в России |
Price английской версии:
59 850 RUB
Price of English version:
1 931$
Price английской версии:
59 850 RUB
Price of English version:
1 931$
Order by phone.: +7 (495) 212-91-91
| Category: |
FAQ (payment, discounts, delivery)
![]() Order by phone.: +7 (495) 212-91-91
Order by phone.: +7 (495) 212-91-91
MARKET OF MEAT
EVALUATION OF THE MARKET STATE AND FORECAST FOR ITS DEVELOPMENT FOR 2014-2016
RUSSIA AND REGIONS OF THE RF
THE WORLD MARKET OF MEAT МИРОВОЙ РЫНОК МЯСА
ANALYSIS OF RETAIL SLAES ON THE MARKET OF MEAT
VOLUME OF THE RUSSIAN MARKET OF MEAT
SEGMENTATION OF THE MARKET OF MEAT
TRENDS ON THE RUSSIAN MARKET OF MEAT
FACTORS AFFECTNG THE MARKET OF MEAT
STATE REGULATION OF THE MARKET OF MEAT
THE LARGEST PLAYERS ON THE MARKET OF MEAT
LIVESTOCK
PRODUCTION OF MEAT ПРОИЗВОДСТВО МЯСА
THE LARGEST RUSSIAN PRODUCERS OF MEAT
EXPORT OF MEAT
IMPORT OF MEAT
PRODUCERS’ PRICES ON THE MARKET OF MEAT
RETAIL PRICES ON THE MARKET OF MEAT
CONSUMER PRICES ON THE MARKET OF MEAT (BASED ON RETAIL AUDIT)
PROFILES OF THE LARGEST ENTERPRISES ON THE MARKET OF MEAT
FORECAST OF THE MARKET OF MEAT FOR 2014-2016
“PTITSEKOMBINAT”, LLC
“CHELNY-BROILER”, LLC
“MIKOYANOVSKY MEAT PLANT”, CJSC
“VELIKOLUKSKY MEAT PLANT”, OJSC
“INVEST ALIYANS”, LLC
The largest enterprises are presented by production volume, financial activity, sheet balances, profit and loss statements, cash-flow statements, subsidiaries and other information.
Federal State Statistics Service
Ministry of Economic Development of RF
Federal Custom Service
Federal Tax Service
The Ministry of agriculture of the USA
Evaluation of Experts of the Branch
Retail sales statements
Data of the main players of the branch
Printed and electronic publications of the branch
The research contains 84 schedules, 62 diagrams, 85 tables, 6 schemes and 1 figure.
Currently animal breeding in Russia is developing following modern world trends. Products of the branch should be competitive with imported products not only by quality but price as well. It should correspond veterinarian and sanitary requirements.
Cattle breeding and poultry breeding are the main branches of the agriculture of the RF, involved into growing of animals for slaughter.

Number of animal heads is by types is distributed unevenly due to difference in periods of fattening.
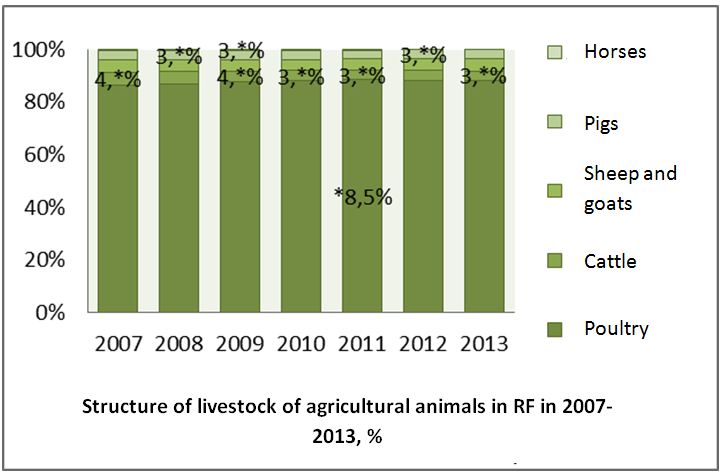
Since 2007 reduction of share of cattle by all types of animals is caused not only by fluctuations of animals number during a calendar year, but mainly by constant increase of domestic poultry.
The smallest share of horse number in the structure of agricultural animals for slaughter correlates with extreme natural climate conditions of horse breeding. The principle method of fattening of horses for slaughter, not worsening taste qualities of meat is pasture breeding which require large amount of land.
Products of Russian animals poultry breeding are fully sold on domestic market. By 20 13 volume of national production of all types of meat in the RD did not satisfy national demand. Share of Russia amounted to 3.*% of world consumption of beef a d veal, *% of pork and *% poultry meat. Due to own sector of animal and poultry breeding population's needs in cattle meat were satisfied by **%, in pork - by **%, in poultry meat - by **%. Another part of products was filled up with import from Brazil, the USA, Argentina and other countries.
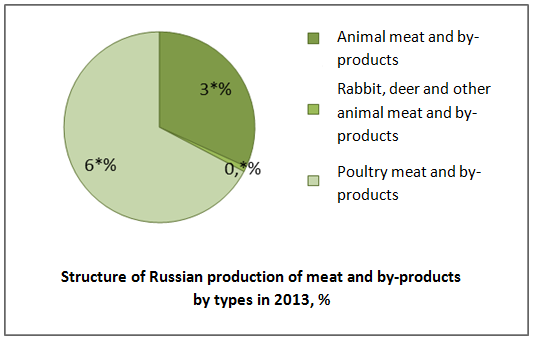
In 2013 the structure of Russian production of meat and offal was constituted by two thirds with products of poultry meat (*%), one third - by cattle and small cattle and pork (**%). Meat and offal of rabbits, hare, North deer, marals and other animals.
Geography of Russian export is rather wide. The following are countries importing Russian products: Gabon, UAE, Republic of Korea, Laos, Spitzbergen, Panama, Republic of South Korea.
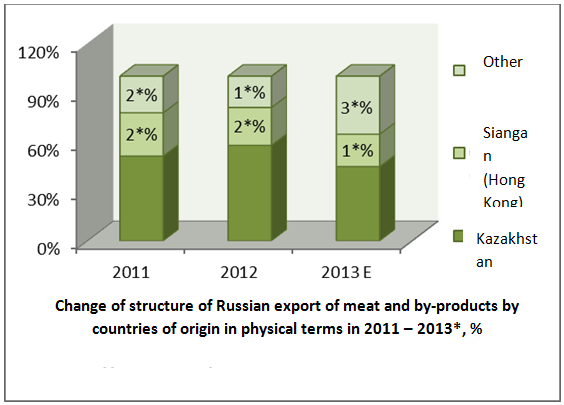
In 2010-2013* the following were exported from Russia to domestic markets of other countries: mutton, beef, animal offal, pork, animals by products, poultry meat and by-products. Share of mutton was insignificant, maximum deliveries of this meat were recorded in 2011 - *% of export volume of the RF. Specific weight of beef grew by 2013* from * to * p.p. Pork meat was almost not exported from the country, it was consumed on the domestic market. By products of animals and also meat and by products of rabbits, deer and other animals are exported from the country in accordance to herd turnover, i.e. it fluctuates from * to * p.p. annually.

In 2013 the structure of Russian export (in physical terms) underwent re-allocation (against 2011), shares of Kazakhstan and Hong Kong reduced (by * and * p.p. correspondingly), while share of other countries increased (by ** p.p.). These changes show the expansion of international trade geography of the RF.
RESEARCH METHODOLOGY
LIST OF SCHEDULES, DIAGRAMS, TABLES AND SCHEMES
1. GENERAL ECONOMIC SITUATION IN RUSSIA
1.1. Population of Russia
1.2. Economic situation
1.3. Special economic zones
1.4. Development of business in Russia
1.5. Investment potential
1.6. Position of Russia in the world
2.SUBJECT OF RESEARCH
2.1 Definition
2.2 Classification
Classification by Russian Classification of Production
Classification by All-Russian Classification of Economic Activities and Products
Classification by Commodity Nomenclature of Foreign Economic Activity
Classification by Russian National Classifier of Economic Activities
3. THE WORLD MARKET OF MEAT
3.1. Structure and dynamics of production and consumption of meat in the world
3.2. Structure and dynamics of import and export of meat in the world
4. ANALYSIS OF RETAIL SALES ON THE MARKET OF MEAT
4.1. Structure and dynamics of retail sales of meat (as a whole)
4.2 Animals meat
Dynamics of retail sales by years
Dynamics of retail sales by quarters
Structure of retail sales by federal districts
The largest regions of RF by retail sales
4.3. Poultry meat
Dynamics of retail sales by years
Dynamics of retail sales by quarters
Structure of retail sales by federal districts
The largest regions of RF by retail sales
5. VOLUME OF RUSSIAN MARKET OF MEAT
5.1. Dynamics of volume of Russian market by years
5.2. Import share on Russian market
5.3. Dynamics of import share
5.4. Consumption per capita
5.5. Balance of demandand supply of meat products
6. SEGMENTATION OF THE MARKET OF MEAT
7.CONSUMPTION OF MEAT
7.1 Dynamics by years
7.2. Consumption volumes by federal districts of RF
7.3. Consumption volumes in regions of RF
8. TRENDS ON RUSSIAN MARKET OF MEAT
8.1. Change of structure of demand for meat
8.2. A trademark as a guarantee of quality of products
8.3. Improvement of quality of meat
8.4 Establishment of agricultural holdings
8.5. Expansion of sales market
8.6. Change of structure of supply on the market of meat and meat products
9. FACTORS AFFECTING THE MARKET OF MEAT
9.1. Speed of animals slaughter weight reaching
9.2. Fodder base
9.3. Requirements to meat quality
9.4. Purchasing power
9.5.Epidemiologic situation
9.6. Environmental safety of production
10. STATE REGULATION OF THE MARKET OF MEAT
10.1. GOST of the RF
10.3. Strategy of development of food and processing industry in the RF until 2020
10.4. Accession of the RF to the WTO
Import taxes
Pork
Cattle
Poultry meat
11. THE LARGEST PLAYERS ON THE MARKET OF MEAT
11.1. Group of companies under the brend profile "PRODO"
About the company
History of company’s development
Assortment of products, trademarks
11.2. Group “CHERKIZOVO”, OJSC
About the company
History of company’s development
Assortment of products, trademarks
11.3. Business complex "GRUPPA AGROKOM", LLC
About the company
History of company’s development
Assortment of products, trademarks
11.4. Group of companies “AGRO-BELOGORIE”, LLC
About the company
History of company’s development
Ассортимент продукции, марки
11.5. Group of companies “RUS-AGRO”
About the company
History of company’s development
Assortment of products, trademarks
11.6. Agricultural holding “MIRATORG”
About the company
History of company’s development
Assortment of products, trademarks
12. LIVESTOCK
12.1. Structure and dynamics of agricultural livestock in Russia
12.2. Cattle livestock
Dynamics of livestock by years
Geography of distribution of livestock by federal districts
Geography of distribution of livestock by regions
12.3. Sheep and goat livestock
Dynamics of livestock by years
Geography of distribution of livestock by federal districts of RF
Geography of distribution of livestock by regions of RF
12.4. Livestock of pigs
Dynamics of livestock by years
Geography of distribution of livestock by federal districts
Geography of distribution of livestock by regions of RF
12.5. Livestock of poultry in Russia
Dynamics of livestock by years
Geography of distribution of livestock by federal districts
Geography of distribution of livestock by regions of RF
13. PRODUCTION OF MEAT
13.1. Food animal meat and by-products
Structure of production by types
Dynamics of volumes of production by years
Dynamics of volumes of production by months
Volumes of production by federal districts of RF
Structure of production by federal districts of RF
Volumes of production in regions of RF
Regional structure of production
13.2. Food meat and by-products of poultry meat
Structure of production by types
Dynamics of volumes of production by years
Dynamics of volumes of production by months.
Volumes of production by federal districts of RF
Structure of production by federal districts of RF
Volumes of production in regions of RF
Regional structure of production
13.3. Food meat and by-products of rabbits, deer and other animals
Dynamics of volumes of production by years
Dynamics of production volumes by months
Volumes of production by federal districts of RF
Structure of production by federal districts of RF
Volumes of production in regions of RF
Regional structure of production
14. THE LARGEST RUSSIAN PRODUCERS OF MEAT
14.1. Animals meat
Proceeds of the largest Russian producers
Regional structure of enterprises location
14.2. Poultry and rabbit meat
Proceeds of the largest Russian producers
Regional structure of enterprises location
15. EXPORT OF MEAT
15.1. Dynamics of volumes of export by years
15.2. Structure of Russian export by types
15.3. Volumes of export by countries of destination
15.4. Structure of export by countries of destinations
16. IMPORT OF MEAT
16.1. Dynamics of volumes of import by years
16.2. Dynamics of volumes of import by months
16.3. Structure of volume of Russian import by types
16.4. Volumes of import by supplying countries
16.5. Structure of volume of import by supplying countries
17. PRODUCERS' PRICES ON THE MARKET OF MEAT
17.1. Beef
Dynamics of prices by years
Dynamics of prices by months
17.2.Pork
Dynamics of prices by years
Dynamics of prices by months
17.3. Mutton
Dynamics of prices by years
Dynamics of prices by months
17.4. Chicken meat
Dynamics of prices by years
Dynamics of prices by months
17.5. Rabbit, deer and other animals meat
Dynamics of prices by years
Dynamics of prices by months
17.6. Animals by-products
Dynamics of prices by years
Dynamics of prices by months
17.7. Poultry by-products
Dynamics of prices by years
Dynamics of prices by months
18. RETAIL SALES ON THE MARKET OF MEAT
18.1.Beef
Dynamics of retail sales for beef (except for boneless meat) by years
Dynamics of retail prices for beef (except for boneless meat) by months
Dynamics of retail prices for beef (boneless meat)
Dynamics of retail prices for beef (boneless meat)
Dynamics of retail prices for beef liver by years
Dynamics of retail prices for beef liver by months
18.2. Pork
Dynamics of retail prices for pork (except for boneless meat) by years
Dynamics of retail prices for pork (except for boneless meat) by months
Dynamics of retail prices for pork (boneless meat) by years
Dynamics or retail prices for pork (boneless meat) by months
18.3. Mutton (in slaughter warm weight)
Dynamics of retail prices for mutton (in slaughter warm weight) by years
Dynamics of retail prices for mutton (in slaughter warm weight) by months
18.4. Poultry meat
Dynamics of retail prices for poultry meat (except for chicken legs) by months
Dynamics of retail prices for poultry meat (except for chicken legs) by months
Dynamics of retail prices for chicken legs by years
Dynamics of retail prices for chicken legs by months
19. CONSUMER PRICES ON THE MARKEY OF MEAT (BASED ON REATIL AUDIT)
19.1. Cattle meat and by-products
19.2. Pigs meat and by-products
19.3. Sheep meat and by-products
19.4. Horse meat and by-products
19.5 Poultry meat and by-products
19.6. Rabbit meat and by-products
20. PROFILES OF THE LARGEST ENTERPRISES ON THE MARKET OF MEAT
20.1. «PTITSEKOMBINAT», LLC
Reference information
Types of activity
Production volumes
Balance sheet
Profit and loss statement
Cash-flow statement
Financials
20.2. «CHELNY-BROYLER», LLC
Types of activity
Balance sheet
Profit and loss statement
Cash-flow statement
Financials
20.3. «MIKOYANOVSKY MYASOKOMBINAT», CJSC
Types of activity
Production volumes
Balance sheet
Profit and loss statement
Cash-flow statement
Financials
20.4. «VELIKOLUKSKY MYASOKOMBINAT», OJSC
Types of activity
Production volumes
Balance sheet
Profit and loss statement
Cash-flow statement
Financials
20.5. «INVEST ALYANS», LLC
Reference information
Types of activity
Balance sheet
Profit and loss statement
Cash-flow statement
Financials
21. FORECAST OF THE VOLUME OF MEAT MARKET FOR 2014-2016
ABOUT INTESCO RESEARCH GROUP
Schedule 1. Population of Russia in 1990, 2000, 2005 and 2008-2013 and forecast for 2014-2016, mln. people
Schedule 2. Dynamics of population of Russia in three variants of forecast in 2011 – 2031, ths. people
Diagram 1. Структура численности населения России по отношению к трудоспособному возрасту в 2014-2031 гг., % (средний вариант прогноза)
Table 1. Численность населения крупнейших городов России по данным Переписей 2002 и 2010 гг. и на 1 января 2013 г., тыс. чел.
Schedule 3. Dynamics of actual household disposable income of population in Russia and its annual rate of growth in 2000 -2013* and forecast for 2014-2016, %
Schedule 4. Dynamics of dependency ratio in three variants of forecast in 2011 – 2031
Schedule 5. Dynamics of employed and unemplyed in Russia in 2000-2013 and forecast for 2014-2015, %
Schedule 6. Dynamics of unemployment share in economically active population by federal districts of RF in 2007-2013, %
Schedule 7. Dynamics of GDP in money terms of 2008 in 2004-2013 and forecastfor 2014-2016 , bln. rub
Schedule 8. Dynamics of GDP in current money terms in 2004-2013 and forecast for 2014-2016, bln. rub
Schedule 9. Dynamics of investments into the capital stock of the RF in 2004-2013 and forecast for 2014-2016 , bln. rub
Schedule 10. Dynamics of surplus/ deficit of consolidated budget of RF in 2006-2013 and forecast for 2014-2016, % to GDP
Diagram 2. Change of structure of profits of the federal budget in 2009-2013, %
Schedule 11. Dynamics of the total external debt of RF and its share in GDP in 2010-2014 (as of January, 1) and a forecast for 2015-2017 , mln. dollars
Diagram 3. Change of structure of theecternal debt of the RF in 2009-2014 (as of January, 1), %
Schedule 12. Dynamics of CPI in 2006-2013 and forecast for 2014-2016, % to the corresponding period of the previous year
Schedule 13. Dynamics of investments into special economic zones in 2006-2013 (as of 01.10.2013 г), mln. rub
Schedule 14. Number of residents of special economic zones in Russia in 2006- 2013 (June 2013) , units
Table 2. Number of small enterprises (except for micro ones) by branches in Russia in 2009 - September 2013 .
Рисунок 1. Distribution of volumes of financing of programs supporting small and medium business from federal and regional budgets by regions on the map of Russia in 2011 - 2013, mln. rub
Table 3. Values for 2012 - 2013 of three leading countries gained the most success in branches researched in the «Doing Business 2014» rating
Table 4. Russian regions in the rating of investment climate in 2012-2013
Schedule 15. Dynamics of volume of foreign investments accumulated in 2005 - 2013, bln.dollars
Diagram 4. Investments accumultaed by investing countries in 2013, %
Table 5. Dynamics of volume of accumulated foreign investments in 2005 - 2013, mln. dollars
Schedule 16. Dynamics of population of Russia and the world in 2000-2013 and a forecast until 2100, mln. people
Schedule 17. Share of the RF in the world GDP in 2001-2013 and forcast for 2014-2016, %
Table 6. Methods of meat classification
Схема 1. Classification of poultry meat
Schedule 18. Dynamics of production od meat in the world in 2009-2013* , ths. t
Diagram 5. Structure of world production of meat in 2009-2013*, %
Schedule 19. Dynamics of meat consumtion i the world in 2009-2013*, ths. t
Diagram 6. Structure of the world meat consumption in 2009-2013*, %
Schedule 20. Dymanics of world import of meat in 2009-2013* , ths. t
Diagram 7. Structure of the world import of meat in 2009-2013*, %
Schedule 21. Dynamics of the world export of meat in 2009-2013* , ths. t
Diagram 8. Structure of the world export of meat in 2009-2013*, %
Diagram 9.Structure of retail sales of meat by types in 2013, %
Diagram 10.Structure of retail sales of meat in 2009-2013, %
Schedule 22. Dynamics of retail sales of animals meat in Russia in 2009-2013, bln. rub.
Schedule 23. Dynamics of retail sales of animals meat in Russia in 2009-2013, bln. rub
Table 7. Volumes of retail sales of animals meat in federal ditricts of the RF in 2009-2013 , bln.rub
Diagram 11. Structure of retail sales of animals meat by federal districts of the RF in cost terms in 2013, %
Diagram 12. Changes of structure of retail sales of animals meat by federal districts of the RF in cost terms in 2009-2013., %
Schedule 24.The largest regions of the RF by volumes of retail sales of animals meat in 2013 г., bln. rub
Table 8. Volume of retail sales of animals meat in regions of the RF in 2009-2013 , ths. rub.
Diagram 13. Regional structure of retail sales of animals meat in 2013 in cost terms, %
Diagram 14. Change of regional structure of retail sales of animals meat in the RF in cost terms in 2009-2013, %
Schedule 25. Dynamics of retail sales of poultry meat in Russia in 2009-2013, bln. rub.
Schedule 26. Dynamics of retail sales of poultry meat in Russia in 2009-2013, bln. rub.
Table 9. Volumes of retail sales of poultry meat in federal districts of the RF in 2009-2013 bln. rub.
Diagram 15. Structure of retail sales of poultry meat by federal districts of RF in cost terms in 2013 , %
Diagram 16. Change of structure of retail sales of poultry meat by federal districts of the RF in cost terms in 2009-2013, %
Schedule 27. The largest regions of the RF by volumes of retail sales of poultry meat in 2013 г., bln. rub
Table 10. Volume of retail sales of poultry meat in regions of the RF in 2009-2013 гг., ths. rub
Diagram 17. Regional structure of retail sales of poultry meat in cost terms in 2013, %
Diagram 18. Change of regional structure of retail sales of poultry meat in the RF in cost terms in 2009-2013, %
Schedule 28. Dynamics of volume of Russian market of meat and by-products in 2009-2013, mln. t
Diagram 19. Share of import on the Russian market of meat and by-products in 2013, in physical terms in 2013 in physical terms, %
Diagram 20. Dynamics of import share on the Russian market meat and by-products in 2009-2013in physical terms, %
Schedule 29. Consumption of meat and by-products per capita in Russia in 2009-2013 t per capita
Table 11. Ресурсы и использование мяса и мясопродуктов в Российской Федерации
Diagram 21. Structure of volume of Russian market of meat and by-products in 2013 in physical terms, %
Diagram 22. Dynamics of the structure of Russian market of meat and by-products in 2009-2013 in physical terms, %
Schedule 30. Consumption of meat and meat products (except for by-products of the II categotry and slaughter fat) in the RF in 2008-2012 kg per capita annually
Table 12. Volume of consumption of meat and meat products in federal districts of the RF in 2008-2012, kg per capita annually
Table 13. Volume of consumption of meat and meat products in regions of the RF in 2009-2012, kg per capita annually
Схема 2. Structure of GOSTs in the RF (meat and meat products)
11. THE LARGEST PLAYERS ON THE MARKET OF MEAT
Схема 3. Structure of the agricultural holding "PRODO"
Схема 4. Structure of the agricultural holding "CHERKIZOVO"
Схема 5. Structure of the agricultural holding "AGRO-BELOGORIE"
Схема 6. Activity direction of the agricultural holding "MIRATORG"
Table 14. Livestock of agricultural animals in the RF in 2007-2013 , ths. animal heads
Diagram 23. Structure of livestick of agricultural animals in the RF in 2007-2013, %
Diagram 24 Structure livestock of agricultural animals by types in the RF in 2013 г., %
Schedule 31. Dynamics cattle livestock in Russia in Russia in 2007-2013, %
Diagram 25. Structure of cattle livestock by categories of farming in the RF in 2013, %
Table 15.Cattle livestock in federal districts of thr RF in 2012-2013, ths. animal heads
Diagram 26. Regional structure of cattle livestock allocationin the RF in 2012-2013
Schedule 32. Dynamics of sheep and goats livestock in Russia in 2000 - 2013, ths. animal heads
Diagram 27. Structure of sheep and goat livestock by categories of farms in RF in 2013, %
Table 16. Livestock of sheep and goats in federal districts of RF in 2012-2013, ths. animal units
Diagram 28. Regional structure of distribution of livestock of sheep and goats in RF in 2012-2013,%
Schedule 33. Dynamics of livestock of pigs in Russia in 2007-2013, ths. animal units
Diagram 29. Structure of livestock of pigs by categories of farms in RF in 2013, %
Table 17. Livestock of pigs in federal districts of RF in 2012-2013, ths. animal units
Diagram 30. Regional structure of distribution of livestock of pigs in RF in 2012-2013, %
Schedule 34. Dynamics of livestock of poultry in Russia in 2007-2013, ths. animal units
Diagram 31. Structure of livestock of poultry by categories of farms in RF in 2013, %
Table 18. Livestock of poultry in federal districts of RF in 2012-2013, ths. animal units
Diagram 32. Regional structure of distribution of livestock of poultry in RF in 2012-2013, %
Diagram 33. Structure of Russian production of meat and by-products by types in 2013, %
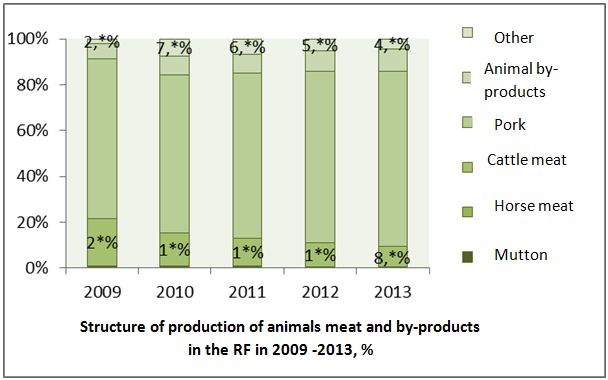
Diagram 34. Structure of production of meat and by-products of animals in RF in 2009-2013, %
Diagram 35. Structure of production of meat and by-products of animals by types in RF in 2013, %
Schedule 35. Dynamics of volume of Russian production of meat and by-products of animals in 2009-2013, tons
Schedule 36. Dynamics of volume of Russian production of meat and by-products of animals by months in 2009-2013, tons
Table 19. Volume of production of meat and by-products of animals in RF by months in 2009-2013, ton
Table 20. Volume of production of meat and by-products of animals in federal districts of RF in 2009-2013, tons
Diagram 36. Structure of production of meat and by-products of animals by federal districts in RF in 2013, %
Diagram 37. Change of structure of production of meat and by-products of animals by federal districts of RF in 2009-2013, %
Table 21. Volume of production of meat and by-products of animals in Russia in 2009-2013, tons
Diagram 38. Regional structure of Russian production of meat and by-products of animals
in 2013 in physical terms, %
Diagram 39. Change of regional structure of Russian production of meat and by-products of animals in 2009-2013, %
Diagram 40. Structure of production of meat and by-products of poultry in 2010-2013, %
Schedule 37. Dynamics of volume of Russian production of meat and by-products of poultry in 2009-2013, ton
Schedule 38. Dynamics of volume of Russian production of meat and by-products of poultry by months in 2009-2013, tons
Table 22. Volume of production of meat and by-products of poultry in RF by months in 2009-2013, tons
Table 23. Volume of production of meat and by-products of poultry in federal districts of RF in 2009-2013, tons
Diagram 41. Structure of production of meat and by-products of poultry by federal districts of RF in 2013,%
Diagram 42. Change of structure of production of meat and by-products of poultry by federal districts of RF in 2009-2013, %
Table 24. Volume of production of meat and by-products of poultry in Russia in 2009-2013, tons
Diagram 43. Regional structure of Russian production of meat and by-products of poultry in 2013, %
Diagram 44. Change of regional structure of Russian production of meat and by-products of poultry in 2009-2013, %
Schedule 39. Dynamics of volume of Russian production of meat and by-products of rabbits, deer and other animals in 2009-2013, tons
Schedule 40. Dynamics of volume of Russian production of meat and by-products of rabbits, deer and other animals by months in 2009-2013, tons
Table 25. Volume of production of meat and by-products of rabbits, deer and other animals in RF by months in 2009-2013, tons
Table 26. Volume of production of meat and by-products of rabbits, deer and other animals in federal districts of RF in 2009-2013, tons
Diagram 45. Structure of production of rabbit, deer and other animal meat and offal by federal districts of RF in 2009-2013, %
Diagram 46. Change of structure of production of meat and by-products of rabbits, deer and other animals by federal districts of RF in 2009-2013, %
Table 27. Volume of production of meat and by-products of rabbits, deer and other animals in Russia in 2009-2013, tons
Diagram 47. Regional structure of Russian production of meat and by-products of rabbits, deer and other animals in 2013, %
Diagram 48. Change of regional structure of production of meat and by-products of rabbits, deer and other animals in RF in 2009-2013, %
Table 28. Dynamics of proceeds of enterprises with the main type of activity according to OKVED: Production of meat (15.11) in the RF in 2007-2012, ths. rub.
Schedule 41. Proceeds of the largest enterprises with the main type of activity by OKVED: Production of meat (15.11) in the RF in 2010, bln.rub
Schedule 42. Proceeds of the largest enterprises with the main type of activity by OKVED: Production of meat (15.11) in the RF in 2011 г., bln. rub
Schedule 43. Proceeds of the largest enterprises with the main type of activity by OKVED: Production of meat (15.11) in the RF in 2012 г., bln. rub.
Diagram 49. Р Regional structure of enterprises with the main types of activity defined by OKVED as “Production of meat” (15.11) in the RF in 2014, %
Table 29. Dynamics of proceeds of enterprises with the main type of activity defined by OKVED as “Production of agricultural poultry and rabbit meat” (15.12) in the RF in 2007-2012 , ths. rub
Schedule 44. Proceeds of enterprises with the main type of activity defined by OKVED as “Production of agricultural poultry and rabbit meat” (15.12) in the RF in 2010 , bln. rub
Schedule 45. Proceeds of enterprises with the main type of activity defined by OKVED as “Production of agricultural poultry and rabbit meat” (15.12) in the RF in 2011 г., bln. rub
Schedule 46. Proceeds of enterprises with the main type of activity defined by OKVED as “Production of agricultural poultry and rabbit meat” (15.12) in the RF in 2012, bln. rub
Diagram 50. Regional structure by enterprises with the main type of activity defined by OKVED as Production of agricultural poultry and rabbit meat (15.12) in the RF in 2014, %
Schedule 47. Dynamics of volume of Russian export of meat and by-products in physical terms in 2007-2013*, ths. tons
Schedule 48. Dynamics of volume of Russian export of meat and by-products in cost terms in 2007-2013*, mln. dollars
Diagram 51. Structure of Russian export of meat and by-products in 2010-2013* in physical terms, %
Diagram 52. Structure of Russian export of meat and by-products in 2010-2013* in cost terms, %
Table 30. Volume of Russian export of meat and by-products by supplying countries in physical terms in 2007-2013*, tons
Table 31. Volume of Russian export of meat and by-products by supplying countries in cost terms in 2007-2013*, dollars.
Diagram 53. Change of structure of Russian export of meat and by-products by countries in physical terms in 2011-2013*, %
Diagram 54. Change of structure of Russian export of meat and by-products by countries in physical terms in 2011-2013*, %
Diagram 55. Structure of Russian export of meat and by-products by countries in cost terms in 2013*, %
Diagram 56. Change of structure of Russian export of meat and by-products by countries in cost terms in 2011-2013*, %
Schedule 49. Dynamics of Russian import of meat and by-products in physical terms in 2007-2013*, ths. tons
Schedule 50. Dynamics of Russian import of meat and by-products in cost terms in 2007-2013*, mln.dollars
Schedule 51. Dynamics of volume of Russian import of meat and by-products in physical terms by months in 2009-2013*, tons
Schedule 52. . Dynamics of volume of Russian import of meat and by-products in cost terms by months in 2009-2013*, ths. dollars
Diagram 57. Structure of Russian import of meat and by-products in 2010-2013, in physical terms, %
Diagram 58. Structure of Russian import of meat and offal in 2010-2013 in cost terms, %
Table 32. Volume of Russian import of meat and offal by countries in physical terms in 2007-2013*, tons
Table 33. Volume of Russian import of meat and offal by countries in cost terms in 2007-2013*, dollars.
Diagram 59. Structure of Russian import of meat and offal by countries of origin in physical terms in 2013*, %
Diagram 60. Change of structure of Russian import of meat and offal by countries of origin in physical terms in 2011-2013*, %
Diagram 61. Structure of Russian import of meat and offal by countries of origin in cost terms in 2013*, %
Diagram 62. Change of structure of Russian import of meat and offal by countries of origin in cost terms in 2011-2013*, %
Schedule 53. Dynamics of average producers’ prices for beef (in a slaughter warm weight) in RF by months in 2007-2013, rub/t
Schedule 54. Dynamics of average producers’ prices for beef (in a slaughter warm weight) in RF by months in 2007-2013, rub/t
Table 34. Average producers’ prices for beef (in a slaughter warm weight) in RF by months in 2007- Feb 2014, rub/t
Schedule 55. Dynamics of average producers’ prices for pork (in a slaughter warm weight) in RF in
в 2007-2013 , rub/t
Schedule 56. Dynamics of average producers’ prices for pork (in a slaughter warm weight) in RF by months in 2007-2013, rub/t
Table 35. Average producers' prices for pork (in a slaughter warm weight) in RF by months in 2007-Feb 2014, rub/t
Schedule 57. Dynamics of average producers’ prices for mutton (in a slaughter warm weight) in RF in 2007-2013 , rub/t
Schedule 58. Dynamics of average producers’ prices for mutton (in a slaughter warm weight) in RF by months in 2007 – 2013, rub/t
Table 36. Average producers' prices for mutton (in a slaughter warm weight) in RF by months in 2007-Feb. 2014, rub/t
Schedule 59. Dynamics of average producers’ prices for chicken meat (in a slaughter warm weight) in RF in
в 2007-2013, rub/t
Schedule 60. Dynamics of average producers’ prices for chicken meat (in a slaughter warm weight) in RF by months in 2007-2013 , rub/t
Table 37. Average producers’ prices for chicken meat (in a slaughter warm weight) in RF by months in 2007-Feb 2014, rub/t
Schedule 61. Dynamics of average producers’ prices for other animals meat in RF in 2009-2013 , rub/t
Schedule 62. Dynamics of average producers’ prices for meat of other animals in RF by months in 2007-2013, rub/t
Table 38. Average producers’ prices for other animals meat in RF by months in 2009-Feb 2014, rub/t
Schedule 63. Dynamics of average producers’ prices for animals by-products in RF in 2007-2013, rub/t
Schedule 64. Dynamics of average producers’ prices for animals by-products in
RF in 2007-2013 , rub/t
Table 39. Average producers’ prices for animals by-products in RF by months in 2007-Feb 2014, rub/t
Schedule 65. Dynamics of average producers’ prices for poultry offal in RF in 2009-2013 , rub/t
Schedule 66. Dynamics of average producers’ prices for poultry offal in RF in April in 2009 -2013, rub/t
Table 40. Average producers’ prices for poultry offal in RF by months in Apr 2009 – Feb 2014, rub/t
Schedule 67. Dynamics of average retail sales for beef (except for boneless meat) in RF in 2007-2013, rub/kg
Schedule 68. Dynamics of average retail prices for beef (except for boneless meat) in RF by months in
2007-2013 , rub/kg
Table 41. Average retail prices for beef (except for boneless meat) in RF by months in 2007- Feb 2014 , ru/t
Schedule 69. Dynamics of average retail prices for beef (boneless meat) in RF in 2007-2013, rub/kg
Schedule 70. Dynamics of average retail prices for beef (boneless meat) in RF by months in 2007-2013, rub/kg
Table 42. Average retail prices for beef (boneless meat) in RF by months in 2007-Feb. 2014 , rub/kg
Schedule 71. Dynamics of average retail prices for beef liver in RF in 2007-2013, rub/kg
Schedule 72. Dynamics of average retail prices for beef liver in RF by months in 2007-2014, rub/kg
Table 43. Average of retail prices for beef liver in RF by months in 2007-Feb 2014 , rub/kg
Schedule 73. Dynamics of average retail prices for pork (except for boneless meat) in RF in 2007-2013, rub/kg
Schedule 74. Dynamics of average retail prices for pork (except for boneless meat) in the RF by months in 2007-2013 , rub/kg
Table 44. Average retail prices for pork (except for boneless meat) in the RF by months in 2007-Feb 2014 , rub/kg
Schedule 75. Dynamics of average retail prices for pork (boneless meat) in the RF in 2007-2013 ,rub/kg
Schedule 76. Dynamics of average retail prices for pork (boneless meat) in the RF by months in 2007-2013, rub/kg
Table 45. Average retail prices for pork (boneless meat) in the RF by months in 2007-Feb 2014, rub/kg
Schedule 77. Dynamics of average retail prices for mutton (slaughter warm weight) in the RF in 2007-2013, rub/ kg
Schedule 78. Dynamics of average retail prices for mutton in (slaughter warm weight) in the RF in 2007-2013, rub/kg
Table 46. Average retail prices for mutton (except for boneless meat) in the RF by months in 2007-Feb2014, kg/rub
Schedule 79. Dynamics of average retail prices for poultry meat (except for chicken legs) in the RF in 2007-2013 , rub/kg
Schedule 80. Dynamics of average retail prices for poultry meat (except for chicken legs) in the RF by months in 2007-2013 , rub/kg
Table 47. Average retail prices for poultry meat (except chicken legs) in the RF by months in 2007-2013 гг., руб/кг, rub/kg
Schedule 81. Dynamics of average retail prices for chicken legs in the RF in 2007-2013 , rub/kg
Schedule 82. Dynamics of average retail prices for chicken legs in the RF by months in 2007-2013 , rub/kg
Table 48. Average retail prices for chicken legs in the RF by months in 2007- Feb 2014 , rub/kg
Table 49. Average retail prices on the Russian market of beef (based on retail audit) as of February 17 – March, 3, 2014
Table 50. Average retail prices on the Russian market of pork based on retail audit) as of February 17 – March, 3, 2014
Table 51. Average retail prices on the Russian market of mutton (based on retail audit) as of February 17 – March 3, 2014
Table 52. Average retail prices on the Russian market of horse meat (based on retail audit) as of February 17 – March 3, 2014.
Table 53. Average retail prices on the Russian market of poultry meat (based on retail audit) as of February 17 – March 3, 2014
Table 54. Average retail prices on the Russian market of rabbit meat (based on retail audit) as of Feb, 17 – March, 3, 2014
Table 55. Shareholders/founders of “PTITSEKOMBINAT”, LLC
Table 56. Production volumes of “PTITSEKOMBINAT”, LLC
Table 57. Balance sheet of “PTITSEKOMBINAT”, LLC
Table 58. Profit and loss statement of “PTITSEKOMBINAT”, LLC
Table 59. Cash-flow statement of “PTITSEKOMBINAT”, LLC
Table 60. Financials
Table 61. Shareholders/founders of “CHELNY-BROYLER”, LLC»
Table 63. Balance sheet «CHELNY-BROYLER», LLC
Table 64. Profit and loss statement of “CHELNY-BROYLER”, LLC
Table 65. Cash-flow statement of “CHELNY-BROYLER”, LL
Table 66. Financials of “CHELNY-BROYLER”, LLC
Table 67. Shareholders/founders of “MIKOYANOVSKY MYASOKOMBINAT”, CJSC
Table 68. Subsidiaries of “MIKOYANOVSKY MYASOKOMBINAT”, CJSC
Table 69. Production volumes of “MIKOYANOVSKY MYASOKOMBINAT”, CJSC
Table 70. Balance sheet of «MIKOYANOVSKY MYASOKOMBINAT», CJSC
Table 71. Profit and loss statement of “MIKOYANOVSKY MYASOKOMBINAT”, CJSC
Table 72. Cash-flow statement of “MIKOYANOVSKY MYASOKOMBINAT”, CJSC
Table 73. Financials of “MIKOYANOVSKY MYASOKOMBINAT”, CJSC
Table 74. Shareholders founders of «VELIKOLUKSKY MYASOKOMBINAT», OJSC
Table 75. Subsidiaries of “VELIKOLUKSKY MYASOKOMBINAT”, OJSC
Table 76. Production volumes of “VELIKOLUKSKY MYASOKOMBINAT”, OJSC
Table 77. Balance sheet «VELIKOLUKSKY MYASOKOMBINAT», OJSC
Table 78. Profit and loss statement of “VELIKOLUKSKY MYASOKOMBINAT”, CJSC
Table 79. Cash-flow statement of “VELIKOLUKSKY MYASOKOMBINAT", OJSC
Table 80. Financials of “VELIKOLUKSKY MYASOKOMBINAT”, CJSC
Table 82. Balance sheet of «INVEST ALYANS», LLC
Table 83. Profit and loss statement of “INVEST ALYANS”, LLC
Table 84. Cash-flow statement of “INVEST ALYANS”, LLC
Table 85. Financials of “Invest Alyans”, LLC
Schedule 83. Dynamics of the Russian market of meat and by-products in 2009-2013 and a forecast for
2014-2016 , mln. t
Schedule 84. Dynamics of share of import products of meat and by-products in 2009-2013 and a forecast for 2014-2016, %
Готовую работу Вы можете заказать по телефону +7 (495) 212-91-91
или оставить заявку на сайте, после чего с Вами свяжется наш менеджер.
Также Вы можете заказать разработку бизнес-плана для Вашего собственного проекта


