 +7 (499) 444-11-26 +7 (499) 444-11-26 |
Реализация инвестиционных проектов в России |
Price английской версии:
59 850 RUB
Price of English version:
1 931$
Price английской версии:
59 850 RUB
Price of English version:
1 931$
Order by phone.: +7 (495) 212-91-91
| Category: |
FAQ (payment, discounts, delivery)
![]() Order by phone.: +7 (495) 212-91-91
Order by phone.: +7 (495) 212-91-91
IT SERVICES MARKET. IT-OUTSOURCING. CLOUD SERVICES.
ASSESSMENT OF SITUATION ON THE MARKET AND FORECAST OF ITS DEVELOPMENT UNTIL 2017.
WORLD, RUSSIA, REGIONS OF RF
WORLD MARKET
RUSSIAN MARKET VOLUME
DEVELOPMENT OF INFORMATION TECHNOLOGIES IN RUSSIA
REVIEW OF THE RUSSIAN IT SERVICES MARKET
TRENDS ON THE RUSSIAN MARKET
FACTORS INFLUENCING THE MARKET
STATE REGULATION OF THE MARKET
IT-SERVICES VOLUME
LARGEST COMPANIES ON IT-MARKET
IT-SERVICES EXPORT
IT-SERVICES IMPORT
CONSUMER PREFERENCES
FORECAST OF IT-SERVICES MARKET DEVELOPMENT UNTIL 2017
LARGEST SUPPLIERS OF PRODUCTS AND SERVICES
«ABSoft»
«LUKOIL-INFORM»
«I-Techo»
«SAP CIS»
«Inline Telecom Solutions»
Production volumes, financials, balance sheets, profit and loss statements, cash flow statements, subsidiary companies and other information about main enterprises are represented.
Federal State Statistics Service
Ministry of economic development of RF
Federal Customs Service
Federal Tax Service
Field expert evaluations
Materials of the field's main players
Field print and electronic publications
The research contains 82 schedules, 72 diagrams, 134 tables, 2 schemes, 1 picture
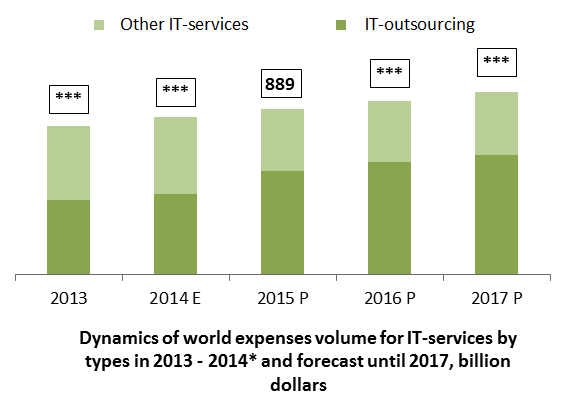
As for the world expenses for outsourcing, we expect that they will increase during the entire period from 2013 to 2017. In case of this in 2014 the increase will be insignificant and will make about 30 billion dollars, however since 2015 rates of growth will increase and by 2017 the share of expenses for IT outsourcing will make **% of the total amount of expenses for IT – about ** billion dollars.
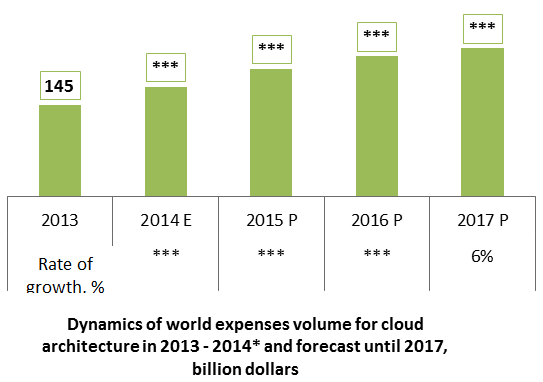
At the same time not only actual volumes but the share of expenses for cloud solutions also will increase in total volume of expenses for IT from 4% in *** and *** to ***% as of the end of the period.
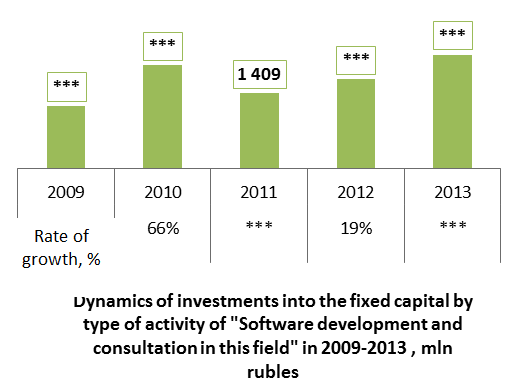
Dynamics of investments into the fixed capital by type of activity of "Software development and consultation in this field" in 2009-2013 was wavy. A high growth rate was marked in 2010 – 66% to the parameter of *** mln rubles. Further, in 2011 the decrease of ***% was marked, then two years of positive growth rates were marked. Thus, by 2013 the market reached the maximum of *** mln rubles during five years.
Sverdlovsk Region was the leading region in Russia by investments volume into the fixed capital by the type of activity of «Data processing» during 2009-2013. And if in 2013 the share of the region was equal to ***% (594,2 mln rubles), then in 2010 – 72% (*** mln rubles).
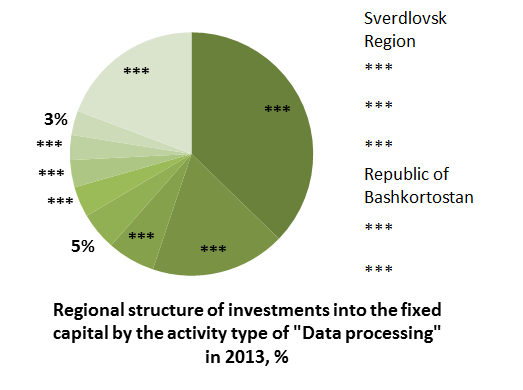
Saint Petersburg ranked *** in 2013 by the investments volume into the fixed capital, and Moscow was not included into the first *** regions. Such a situation was the result of *** and ***.
Software development and consultation in this field annually increased the share in structure of the rendered IT services: from **% in 2011 to **% in 2012 and **% in **.
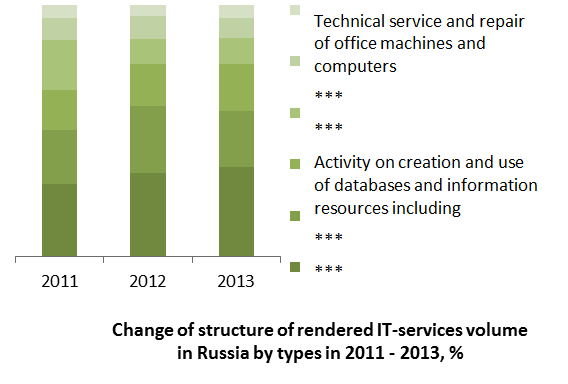
Each fifth service, rendered in 2013, in the IT sphere was connected to databases and information resources that **% exceeds a similar parameter of 2011. The share of consulting services in the field of hardware was cut by half for the considered period – from **% to **%.
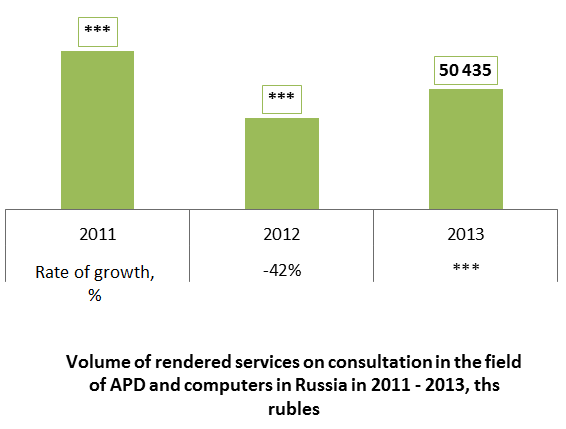
The maximum volume of rendered consulting services in the field of hardware on a temporal interval of 2011-2013 fell on the beginning of the period when such services were rendered on the amount of about **,5 billion rubles then decreased by ***% followed in 2012.
However in 2013 already the parameter was partially recovered to the mark of 50,4 billion rubles. But if in 2011 the share of consultations on hardware in a total amount of rendered IT services was equal to **%, in two years this parameter reduced by **%.
RESEARCH METHODOLOGY
LIST OF SCHEDULES, DIAGRAMS, TABLES AND SCHEMES
1. GENERAL ECONOMIC SITUATION IN RUSSIA
1.1. Population of Russia
1.2. Economic situation
1.3. Special economic zones
1.4. Business development in Russia
1.5. Investment potential
1.6. Position of Russia in the world
2. SUBJECT OF RESEARCH
2.1. Definition
2.2. Classification
Classification by Russian national classifier of economic activities
Types of IT-outsourcing
3. WORLD MARKET
3.1. Trends of the world IT market
3.2. World IT market
Volume of world expenses
Structure of the world market
3.3. World market of cloud technologies
3.4. World IT-outsourcing market
3.5. USA
3.6. Asian-Pacific Region
3.7. India
3.8. Australia
4. RUSSIAN MARKET VOLUME
4.1. IT services market
4.2. IT outsourcing market
4.3. Cloud technologies market
5. DEVELOPMENT OF INFORMATION TECHNOLOGIES IN RUSSIA
5.1. IT industry review
Number of IT organizations
Structure of IT organizations
5.2. IT development in Russian organizations
Use of the Internet network
Web-site use
E-mail use
Provision of employees with mobile devices with the Internet access
Use of protective measures
Use of ERP-systems
Use of SCM-systems
Use of CRM-systems
Use of electronic documents turnover systems
Use of purchases management software
Use of sales management software
Possibility of order on the Internet
6. REVIEW OF THE RUSSIAN IT SERVICES MARKET
6.1. Activity associated to the use of computers and information technologies
Dynamics of investments into the fixed capital
Foreign foreign investments
Proceeds of enterprises
Profit/loss of enterprises
Number of employees
6.2. Consultation on ADP equipment hardware
Dynamics of investments into the fixed capital
Foreign foreign investments
Proceeds of enterprises
Profit/loss of enterprises
Number of employees
6.3. Software development and consultation in this field
Dynamics of investments into the fixed capital
Foreign foreign investments
Proceeds of enterprises
Profit/loss of enterprises
Number of employees
6.4. Data processing
Dynamics of investments into the fixed capital
Foreign foreign investments
Proceeds of enterprises
Profit/loss of enterprises
Number of employees
6.5. Activity on creation and use of databases including the Internet network resources
Dynamics of investments into the fixed capital
Foreign foreign investments
Proceeds of enterprises
Profit/loss of enterprises
Number of employees
6.6. Technical service and repair of office machines and ADP equipment
Dynamics of investments into the fixed capital
Foreign foreign investments
Proceeds of enterprises
Profit/loss of enterprises
Number of employees
6.7. Other activity associated to the use of computers and information technologies
Dynamics of investments into the fixed capital
Foreign foreign investments
Proceeds of enterprises
Profit/loss of enterprises
Number of employees
7. TRENDS ON THE RUSSIAN MARKET
7.1. IT services market
7.2. Trends of IT-outsourcing market
7.3. Trends of cloud services
7.4. IT in state sector
7.5. IT in bank sector
8. FACTORS INFLUENCING THE MARKET
9. STATE REGULATION OF THE MARKET
9.1. IT development
9.2. Information security
9.3. Information technology and information protection
10. VOLUME OF IT SERVICES IN RUSSIA
10.1. Activity associated to the use of computers and information technologies
Services volume
Services structure
10.2. Software development and consultation in this field
Services volume
Services structure
10.3. Activity on creation and use of databases including the Internet network resources
Services volume
Services structure
10.4. Consultation on ADP equipment hardware
Services volume
Services structure
10.5. Data processing
Services volume
Services structure
10.6. Technical service and repair of office machines and ADP equipment
Services volume
Services structure
10.7. Other activity associated to the use of computers and information technologies
Services volume
Services structure
10.8. Organizations costs on ICT
Expenses volume
Expenses structure
11. LARGEST COMPANIES ON IT MARKET
11.1. By proceeds volume
Consultation
Software development
Data processing
Databases creation
Technical service
Other IT services
12. IT-SERVICES EXPORT
12.1. Russian export volume
12.2. Russian export structure
13. IT-SERVICES IMPORT
13.1. Russian import volume
13.2. Russian import structure
14. CONSUMER PREFERENCES
14.1. Choice of IT-outsourcing services provider
14.2. Main SaaS-services consumers
14.3. Choice of SaaS-systems provider
15. FORECAST OF IT SERVICES MARKET DEVELOPMENT UNTIL 2017
15.1. IT services market
15.2. IT outsourcing market
15.3. Cloud technologies market
16. PROFILES OF THE LARGEST ENTERPRISES
16.1. ABSoft
Reference information
Activities
Balance sheet
Financials
16.2. LUKOIL-INFORM
Reference information
Activities
Subsidiaries
Balance sheet
Cash-flow statement
Financials
16.3. I-Techo
Reference information
Activities
Subsidiaries
Cash-flow statement
Financials
16.4. SAP CIS
Reference information
Activities
Subsidiaries
Balance sheet
Cash-flow statement
Financials
16.5. Inline Telecom Solutions
Reference information
Activities
Balance sheet
Cash-flow statement
Financials
ANNEX 1. LARGEST SUPPLIERS OF PRODUCTS AND SERVICES
ABOUT INTESCO RESEARCH GROUP
Schedule 1. Dynamics of resident population number of Russia in 1990, 2000, 2005 and 2008-2013 and forecast for 2014-2016, mln people
Schedule 2. Dynamics of population of Russia in three forecast variants in 2014-2031, ths people
Diagram 1. Structure of population of Russia by working age in 2014-2031, % (average forecast variant)
Table 1. Population number of the largest cities of Russia according to All-Russian census of 2002 and 2010 and as for January 1, 2013, ths people
Schedule 3. Dynamics of actual household disposable income of population and annual rate ofs growth in 2000-2013* and forecast for 2014-2016, %
Schedule 4. Dynamics of demographic load coefficient in three forecast variants in 2014-2031
Schedule 5. Dynamics of the employed and the unemployed in Russia in 2000-2013 and forecast for 2014-2015, %
Schedule 6. Dynamics of share of the unemployed in economically active population by federal districts of RF in 2007-2013, %
Schedule 7. Dynamics of GDP of Russia in prices of 2008 in 2004-2013 and forecast for 2014-2016, billion rubles
Schedule 8. Dynamics of GDP of Russia in actual prices in 2004-2013 and forecast for 2014-2016, billion rubles
Schedule 9. Dynamics of investments into the main capital of RF in 2004-2013 and forecast for 2014-2016, billion rubles
Schedule 10. Dynamics of surplus/deficit of consolidated budget of RF in 2006-2013 and forecast for 2014-2016, % to GDP
Diagram 2. Change of structure of federal budget proceeds in 2009-2013, %
Schedule 11. Dynamics of total external debt of RF and its share in GDP in 2010-2014 (as of January 1) and forecast for 2015-2017, mln dollars
Diagram 3. Change of structure of external debt of RF in 2009-2014 (as of January 1), %
Schedule 12. Dynamics of CPI in 2006-2013 ad forecast for 2014-2016, % to the corresponding period of the previous year
Schedule 13. Dynamics of investments into special economic zones accrued total in 2006-2013 (as of 01.10.2013), mln rubles.
Schedule 14. Number of residents of special economic zones in Russia in 2006- 2013 (June 2013), people
Table 2. Number of small enterprises (without micro-enterprises) by branches in Russia in 2009-September 2013
Picture 1. Distribution of financing volumes of small and medium-sized enterprises from federal and regional budgets by regions on the Russian map in 2011-2013 , mln rubles.
Table 3. Parameters during 2012-2013 of three leading countries gained the success in branches being the subject of the rating «Doing Business 2014»
Table 4. Distribution of Russian regions by rating of investment climate in 2012-2013
Schedule 15. Dynamics of accumulated foreign investments volume in 2005-2013, billion dollars
Diagram 4. Foreign investments accumulated by investing countries in 2013, %
Table 5. Dynamics of foreign investments volume accumulated in TOP-15 regions in 2005-2013, mln dollars
Schedule 16. Dynamics of population of Russia and world in 2000-2013 and forecast up to 2100, mln people
Schedule 17. Share of RF in the world GDP in 2001-2013 and forecast for 2014-2016, %
Scheme 1. Classification of IT-outsourcing by degree of the contractor involvement
Schedule 18. Structure of business expenses by directions in 2014 - 2015, %
Schedule 19. Dynamics of world expenses volume for IT by types in 2013 - 2014* and forecast until 2017, billion dollars
Table 6. Volume of world expenses for IT in 2012-2014* and forecast until 2018, billion dollars
Table 7. Volume of world expenses for IT in 2013 - 2014*, billion dollars
Diagram 5. Change of structure of world expenses for IT by types in 2013 - 2014* and forecast until 2017, %
Diagram 6. Change of world expenses for IT by types in 2012-2014* and forecast unril 2018, %
Diagram 7. Change of structure of world expenses for IT in 2012 - 2014*, %
Diagram 8. Structure of world expenses for IT by types in 2013, %
Diagram 9. Structure of the world IT-services market by proceeds volume of suppliers in 2013*, %
Schedule 20. Distribution of several cloud technologies in business in 2013, %
Schedule 21. Dynamics of world expenses volume for cloud architecture in 2013 - 2014* and forecast until 2017, billion dollars
Diagram 10. Change of structure of world expenses for cloud architecture by types in 2013 - 2014* and forecast until 2017, %
Diagram 11. Change IT-processes share, outsourced, in 2013 - 2014* and forecast until 2018, %
Schedule 22. Dynamics of world expenses volume for IT-services by types in 2013 - 2014* and forecast until 2017, billion dollars
Table 8. Expenses volume for IT on the USA market by type of products in 2012 - 2014* and forecast until 2017, mln dollars
Diagram 12. Change of structure expenses for IT in USA by type of products in 2012 - 2014* and forecast until 2017, %
Diagram 13. The USA share in volume of world expenses for IT in 2013-2014* and forecast until 2017, %
Diagram 14. The USA share in volume of world expenses for IT-services in 2013 - 2014* and forecast until 2017, %
Schedule 23. Dynamics of expenses volume for IT in Asian Pacific Region in 2013 - 2014* and forecast until 2017, billion dollars
Table 9. Expenses volume for IT by type of products to India in 2013 - 2014* and forecast until 2017, mln dollars
Table 10. Expenses volume for services of public cloud services to India in 2013 - 2014* and forecast until 2018, mln dollars
Diagram 15. Export share in IT branch by type of products to India in 2013, %
Table 11. Expenses volume for IT in Australia by type of products in 2013 - 2014, billion dollars
Table 12. Expenses structure for IT in Australia by type of products in 2014*, %
Schedule 24. Dynamics of the Russian IT-services market volume in 2011 - 2014*, billion rubles
Diagram 16. Import share on Russian IT-services market in 2011 - 2013, %
Schedule 25. Russian market volume Of IT-outsourcing in 2011 - 2014*, billion rubles
Diagram 17. Share of IT-outsourcing on Russian IT-services market in 2011 - 2014*, %
Schedule 26. Dynamics of Russian cloud services market volume in 2012 - 2014*, billion rubles
Diagram 18. Change of structure of Russian cloud services market in 2012 - 2014*, %
Schedule 27. Dynamics of organizations number, activity of which is associated to computers and information technologies in 2012 - 2014, units
Table 13. Number of organizations, activity of which is associated to computers and information technologies, by type of property in 2012 - 2014, units
Diagram 19. Change of organizations structure, activity of which is associated to computers and information technologies, by type of property in 2012 - 2014, units
Table 14. Share of organizations, using information and communication technologies by types of technologies in total number of surveyed organizations in 2010 - 2012, %
Table 15. Share of organizations, using information and communication technologies, by types of activity in total number of surveyed organizations in 2012, %
Table 16. Share of organizations, used for information protection, transferred on global networks, in total number of the surveyed organizations in 2010 - 2012, %
Table 17. Share of organizations, using speciual software, by type of software in total number of the surveyed organizations in 2010 - 2012, %
Table 18. Share of organizations, using Internet, by federal districts in total number of the surveyed organizations in 2010-2012, %
Table 19. Share of organizations, using Internet, by regions in total number of the surveyed organizations in 2010 - 2012, %
Table 20. Share of organizations, having broadband Internet connection, by federal districts in total number of the surveyed organizations in 2010 - 2012, %
Table 21. Share of organizations, having broadband Internet connection, by regions in total number of the surveyed organizations in 2010 - 2012, %
Table 22. Share of organizations, using the Internet access with a speed not less 2 Mb/s, by federal districts in total number of the surveyed organizations in 2010 - 2012, %
Table 23. Share of organizations, using the Internet access with a speed not less 2 Mb/s, by regions in total number of the surveyed organizations in 2010 - 2012, %
Table 24. Share of organizations, having the web-site, by federal districts in total number of the surveyed organizations in 2010 - 2012, %
Table 25. Share of organizations, having the web-site, by regions in total number of the surveyed organizations in 2010 - 2012, %
Table 26. Share of organizations, using e-mail, by federal districts in total number of the surveyed organizations in 2010 - 2012, %
Table 27. Share of organizations, using e-mail, by regions in total number of the surveyed organizations in 2010 - 2012, %
Table 28. Share of organizations allocating technical means for mobile Internet access to the workers, by federal districts in total number of the surveyed organizations in 2011-2012, %
Table 29. Share of organizations allocating technical means for mobile Internet access to the workers, by regions in total number of the surveyed organizations in 2011 - 2012, %
Table 30. Share of organizations, used for information protection, transferred on global networks, by federal districts in total number of the surveyed organizations in 2010 - 2012, %
Table 31. Share of organizations, used for information protection, transferred on global networks, by regions in total number of the surveyed organizations in 2010 - 2012, %
Table 32. Share of organizations, using EPR-systems, by federal districts in total number of the surveyed organizations in 2010 - 2012, %
Table 33. Share of organizations, using EPR-systems, by regions in total number of the surveyed organizations in 2010 - 2012, %
Table 34. Share of organizations, using SCM-systems, by federal districts in total number of the surveyed organizations in 2011 - 2012, %
Table 35. Share of organizations, using SCM-systems, by regions in total number of the surveyed organizations in 2011 - 2012, %
Table 36. Share of organizations, using CRM-systems, by federal districts in total number of the surveyed organizations in 2010 - 2012, %
Table 37. Share of organizations, using CRM-systems, by regions in total number of the surveyed organizations in 2010 - 2012, %
Table 38. Share of organizations, using electronic documents turnover systems, by federal districts in total number of the surveyed organizations in 2011 - 2012, %
Table 39. Share of organizations, using electronic documents turnover systems, by regions in total number of the surveyed organizations in 2011 - 2012, %
Table 40. Share of organizations, having special program means for goods purchases (works, services), by federal districts in total number of the surveyed organizations in 2011 -2012, %
Table 41. Share of organizations, having special program means for goods purchases (works, services), by regions in total number of the surveyed organizations in 2011 -2012, %
Table 42. Share of organizations, having special program means for products sales management (works, services), by federal districts in total number of the surveyed organizations in 2011 -2012, %
Table 43. Share of organizations, having special program means for products sales management (works, services), by regions in total number of the surveyed organizations in 2011 -2012, %
Table 44. Share of organizations, receiving orders for produced products (works, services) on the Internet, by federal districts in total number of the surveyed organizations in 2010 -2012, %
Table 45. Share of organizations, receiving orders for produced products (works, services) on the Internet, by regions in total number of the surveyed organizations in 2010 -2012, %
Schedule 28. Dynamics of investments into the fixed capital by type of activity, associated to computers and information technologies use in general, in 2009-2013, ths rubles
Diagram 20. Regional structure of investments into the fixed capital by type of activity, associated to computers and information technologies use in general, in 2013, %
Table 46. Volumes of investments into the fixed capital by type of activity, associated to computers and information technologies use in general, in 30 leading regions in 2009-2013, ths rubles
Schedule 29. Dynamics of foreign investments, received during the surveyed period by type of activity, associated to computers and information technologies use in general,in Russia in 2009-2013, ths rubles
Diagram 21. Structure of foreign investments, received during the surveyed period by type of activity, associated to computers and information technologies use in general, by countries in Russia in 2013, %
Table 47. Volumes foreign investments, received during the surveyed period by type of activity «Consultation on ADP equipment hardware» by countries in Russia in 2009-2013, ths rubles
Schedule 30. Dynamics of companies proceeds (net) before taxation from sales of goods and services by type of activity, associated to computers and information technologies use in general, in 2008-2013, mln rubles
Diagram 22. Regional structure by proceeds of companies (net) before taxation from sales of goods and services by type of activity, associated to computers and information technologies use in general, in 2013, %
Table 48. Volumes companies proceeds (net) before taxation from sales of goods and services by type of activity, associated to computers and information technologies use in general, in 30 leading regions by this parameter in 2008- 1 qtr. of 2014, ths rubles
Schedule 31. Dynamics of profit (loss) before taxation from the beginning of the reporting year by type of activity, associated to computers and information technologies use in general,in Russia in 2008 - 2013, ths rubles
Schedule 32. Dynamics of profit (loss) before taxation from the beginning of the reporting year by type of activity, associated to computers and information technologies use in general,in Russia by quarters in 2008 - 1 qtr. of 2014, ths rubles
Table 49. Volumes profit (loss) before taxation from the beginning of the reporting year by type of activity «Consultation on ADP equipment hardware» in 30 leading regions by this parameter in 2009 - 1 qtr. of 2014ths rubles
Schedule 33. Dynamics of number of personnel on the enterprises by type of activity, associated to computers and information technologies use in general, in Russia in 2009 - 1 qtr. of 2014, people
Diagram 23. Regional structure of number of personnel by type of activity, associated to computers and information technologies use in general, in the first quarter of 2014, %
Table 50. Number of employees by type of activity, associated to computers and information technologies use in general, in 30 leading regions by this parameter in 2009- 1 qtr. of 2014, people
Schedule 34. ynamics of investments into the fixed capital by type of activity «Consultation on ADP equipment hardware» in 2009-2013, ths rubles
Diagram 24. Regional structure of investments into the fixed capital by type of activity «Consultation on ADP equipment hardware» in 2013, %
Table 51. Volumes of investments into the fixed capital by type of activity «Consultation on ADP equipment hardware» in 2009-2013, ths rubles
Schedule 35. Dynamics of foreign investments, received during the surveyed period by type of activity «Consultation on ADP equipment hardware» in Russia in 2009-2013, ths rubles
Diagram 25. Structure of foreign investments, received during the surveyed period by type of activity «Consultation on ADP equipment hardware» by countries in Russia in 2013, %
Table 52. Volumes of foreign investments, received during the surveyed period by type of activity «Consultation on ADP equipment hardware» by countries in Russia in 2009-2013, ths rubles
Schedule 36. Dynamics of companies proceeds (net) before taxation from sales of goods and services by type of activity «Consultation on ADP equipment hardware» in 2008-2013, mln rubles
Diagram 26. Regional structure by proceeds of companies (net) before taxation from sales of goods and services by type of activity «Consultation on ADP equipment hardware» in 2013, %
Table 53. Volumes of companies proceeds (net) before taxation from sales of goods and services by type of activity «Consultation on ADP equipment hardware» in 15 regions leading by this parameter in 2008- 1 qtr. of 2014, ths rubles
Schedule 37. Dynamics of profit (loss) before taxation from the beginning of the reporting year by type of activity «Consultation on ADP equipment hardware» in Russia in 2008 - 2013, ths rubles
Schedule 38. Dynamics of profit (loss) before taxation from the beginning of the reporting year by type of activity «Consultation on ADP equipment hardware» in Russia by quarters in 2008 - 1 qtr. of 2014ths rubles
Table 54. Volumes of profit (loss) before taxation from the beginning of the reporting year by type of activity «Consultation on ADP equipment hardware» in 15 regions leading by this parameter in 2008 - 1 qtr. of 2014ths rubles
Schedule 39. Dynamics of number of personnel on the enterprises by type of activity «Consultation on ADP equipment hardware» in Russia in 2009 - 1 qtr. of 2014, people
Diagram 27. Regional structure of number of personnel by type of activity «Consultation on ADP equipment hardware» in the first quarter of 2014, %
Table 55. Number of employees by type of activity «Consultation on ADP equipment hardware» in 15 regions leading by this parameter in 2009- 1 qtr. of 2014, people
Schedule 40. Dynamics of investments into the fixed capital by type of activity «Software development and consultation in this field» in 2009-2013, ths rubles.
Diagram 28. Regional structure of investments into the fixed capital by type of activity «Software development and consultation in this field» in 2013, %
Table 56. Volumes of investments into the fixed capital by type of activity «Software development and consultation in this field» in 15 leading regions in 2009-2013, ths rubles
Schedule 41. Dynamics of foreign investments, received during the surveyed period by type of activity «Software development and consultation in this field» in Russia in 2009-2013, ths rubles
Diagram 29. Structure of foreign investments, received during the surveyed period by type of activity «Software development and consultation in this field» by countries in Russia in 2013, %
Table 57. Volumes of foreign investments, received during the surveyed period by type of activity «Software development and consultation in this field» by countries in Russia in 2009-2013, ths rubles
Schedule 42. Dynamics of companies proceeds (net) before taxation from sales of goods and services by type of activity «Software development and consultation in this field» in 2008-2013, mln rubles
Diagram 30. Regional structure by proceeds of companies (net) before taxation from sales of goods and services by type of activity «Software development and consultation in this field» in 2013, %
Table 58. Volumes of companies proceeds (net) before taxation from sales of goods and services by type of activity «Software development and consultation in this field» in 15 regions leading by this parameter in 2008 – 1 qtr. of 2014ths rubles
Schedule 43. Dynamics of profit (loss) before taxation from the beginning of the reporting year by type of activity «Software development and consultation in this field» in Russia in 2008 - 2013, ths rubles
Schedule 44. Dynamics of profit (loss) before taxation from the beginning of the reporting year by type of activity «Software development and consultation in this field» in Russia by quarters in 2008 - 1 qtr. of 2014ths rubles
Table 59. Volumes of profit (loss) before taxation from the beginning of the reporting year by type of activity «Software development and consultation in this field» in 15 regions leading by this parameter in 2009 - 1 qtr. of 2014ths rubles
Schedule 45. Dynamics of number of personnel on the enterprises by type of activity «Software development and consultation in this field» in Russia in 2009 - 1 qtr. of 2014, people
Diagram 31. Regional structure of number of personnel by type of activity «Software development and consultation in this field» in the first quarter of 2014, %
Table 60. Number of employees by type of activity «Software development and consultation in this field» in 15 regions leading by this parameter in 2009 – 1 qtr. of 2014, people
Schedule 46. Dynamics of investments into the fixed capital by type of activity «Data processing» in 2008-2013, ths rubles
Diagram 32. Regional structure of investments into the fixed capital by type of activity «Data processing» in 2013, %
Table 61. Volumes of investments into the fixed capital by type of activity «Data processing» in 15 leading regions by this parameter in 2008-2013, ths rubles
Schedule 47. Dynamics of foreign investments, received during the surveyed period by type of activity «Data processing» in Russia in 2009-2013, ths rubles
Diagram 33. Structure of foreign investments, received during the surveyed period by type of activity «Data processing» by countries in Russia in 2013, %
Table 62. Volumes of foreign investments, received during the surveyed period by type of activity «Data processing» by countries in Russia in 2009-2013, ths rubles
Schedule 48. Dynamics of companies proceeds (net) before taxation from sales of goods and services by type of activity «Data processing» in 2008-2013, mln rubles
Diagram 34. Regional structure by proceeds of companies (net) before taxation from sales of goods and services by type of activity «Data processing» in 2013, %
Table 63. Volumes of companies proceeds (net) before taxation from sales of goods and services by type of activity «Data processing» in 15 regions leading by this parameter in 2008 – 1 qtr. of 2014ths rubles
Schedule 49. Dynamics of profit (loss) before taxation from the beginning of the reporting year by type of activity «Data processing» in Russia in 2008 - 2013, ths rubles
Schedule 50. Dynamics of profit (loss) before taxation from the beginning of the reporting year by type of activity «Data processing» in Russia by quarters in 2008 - 1 qtr. of 2014ths rubles
Table 64. Volumes of profit (loss) before taxation from the beginning of the reporting year by type of activity «Data processing» in 15 regions leading by this parameter in 2009‑1 qtr. of 2014ths rubles
Schedule 51. Dynamics of number of personnel on the enterprises by type of activity «Data processing» in Russia in 2009 - 1 qtr. of 2014, people
Diagram 35. Structure of number of personnel by type of activity «Data processing» by regions in the first quarter of 2014, %
Table 65. Number of employees by type of activity «Data processing» in 15 regions leading by this parameter in 2009 – 1 qtr. of 2014, people
Schedule 52. Dynamics of investments into the fixed capital by type of activity «Creation and use of databases and information resources» in 2009-2013, ths rubles
Diagram 36. Regional structure of investments into the fixed capital by type of activity «Creation and use of databases and information resources» in 2013, %
Table 66. Volumes of investments into the fixed capital by type of activity «Creation and use of databases and information resources» in 15 regions leading by this parameter in 2009 - 2013, ths rubles
Schedule 53. Dynamics of foreign investments, received during the surveyed period by type of activity «Creation and use of databases and information resources» in Russia in 2009-2013, ths rubles
Diagram 37. Structure of foreign investments, received during the surveyed period by type of activity «Creation and use of databases and information resources» by countries in Russia in 2013, %
Table 67. Volumes of foreign investments, received during the surveyed period by type of activity «Creation and use of databases and information resources» by countries in Russia in 2009 - 2013, ths rubles
Schedule 54. Dynamics of companies proceeds (net) before taxation from sales of goods and services by type of activity «Creation and use of databases and information resources» in 2008-2013, mln rubles
Diagram 38. Regional structure by proceeds of companies (net) before taxation from sales of goods and services by type of activity «Creation and use of databases and information resources» in 2013, %
Table 68. Volumes of companies proceeds (net) before taxation from sales of goods and services by type of activity «Creation and use of databases and information resources» in 15 regions leading by this parameter in 2008-1 qtr. of 2014ths rubles
Schedule 55. Dynamics of profit (loss) before taxation from the beginning of the reporting year by type of activity «Creation and use of databases and information resources» in Russia in 2008 - 2013, ths rubles
Schedule 56. Dynamics of profit (loss) before taxation from the beginning of the reporting year by type of activity «Creation and use of databases and information resources» in Russia by quarters in 2008 - 1 qtr. of 2014ths rubles
Table 69. Volumes of profit (loss) before taxation from the beginning of the reporting year by type of activity «Creation and use of databases and information resources» in 15 regions leading by this parameter in 2008 - 1 qtr. of 2014ths rubles
Schedule 57. Dynamics of number of personnel on the enterprises by type of activity «Creation and use of databases and information resources» in Russia in 2009 - 1 qtr. of 2014, people
Diagram 39. Structure of number of personnel by type of activity «Creation and use of databases and information resources» by regions in the first quarter of 2014, %
Table 70. Number of employees by type of activity «Creation and use of databases and information resources» in 15 regions leading by this parameter in 2009 – 1 qtr. of 2014, people
Schedule 58. Dynamics of investments into the fixed capital by type of activity «Technical service and repair of office machines and ADP equipment» in 2013, ths rubles
Diagram 40. Regional structure of investments into the fixed capital by type of activity «Technical service and repair of office machines and ADP equipment» in 2013, %
Table 71. Volumes of investments into the fixed capital by type of activity «Technical service and repair of office machines and ADP equipment» in 15 leading regions by this parameter in 2009 - 2013, ths rubles
Schedule 59. Dynamics of foreign investments by type of activity «Technical service and repair of office machines and ADP equipment» in Russia in 2010-2013, ths rubles
Table 72. Volumes of foreign investments, received during the surveyed period by type of activity «Technical service and repair of office machines and ADP equipment» by countries in Russia in 2010-2013, ths rubles
Schedule 60. Dynamics of companies proceeds (net) before taxation from sales of goods and services by type of activity «Technical service and repair of office machines and ADP equipment» in 2008-2013, mln rubles
Diagram 41. Regional structure by proceeds of companies (net) before taxation from sales of goods and services by type of activity «Technical service and repair of office machines and ADP equipment» in 2013, %
Table 73. Volumes of companies proceeds (net) before taxation from sales of goods and services by type of activity «Technical service and repair of office machines and ADP equipment» in 15 regions leading by this parameter in 2008 – 1 qtr. of 2014, ths rubles
Schedule 61. Dynamics of profit (loss) before taxation from the beginning of the reporting year by type of activity «Technical service and repair of office machines and ADP equipment» in Russia in 2008 - 2013, ths rubles
Schedule 62. Dynamics of profit (loss) before taxation from the beginning of the reporting year by type of activity «Technical service and repair of office machines and ADP equipment» in Russia by quarters in 2008 - 1 qtr. of 2014ths rubles
Table 74. Volumes of profit (loss) before taxation from the beginning of the reporting year by type of activity «Technical service and repair of office machines and ADP equipment» in 15 regions leading by this parameter in 2008 - 1 qtr. of 2014ths rubles
Schedule 63. Dynamics of number of personnel on the enterprises by type of activity «Technical service and repair of office machines and ADP equipment» in Russia in 2009 - 1 qtr. of 2014, people
Diagram 42. Structure of number of personnel by type of activity «Technical service and repair of office machines and ADP equipment» by regions in the first quarter of 2014, %
Table 75. Number of employees by type of activity «Technical service and repair of office machines and ADP equipment» in 15 regions leading by this parameter in 2009 – 1 qtr. of 2014, people
Schedule 64. Dynamics of investments into the fixed capital by type of activity «Other activity associated to the use of computers and information technologies» in 2013, ths rubles
Diagram 43. Regional structure of investments into the fixed capital by type of activity «Other activity associated to the use of computers and information technologies» in 2013, %
Table 76. Volumes of investments into the fixed capital by type of activity «Other activity associated to the use of computers and information technologies» in 15 leading regions in 2009 - 2013, ths rubles
Schedule 65. Dynamics of foreign investments, received during the surveyed period by type of activity «Other activity associated to the use of computers and information technologies» in Russia in 2009-2013, ths rubles
Diagram 44. Structure of foreign investments, received during the surveyed period by type of activity «Other activity associated to the use of computers and information technologies», by countries in Russia in 2013, %
Table 77. Volumes of foreign investments, received during the surveyed period by type of activity «Other activity associated to the use of computers and information technologies», by countries in Russia in 2009-2013, ths rubles
Schedule 66. Dynamics of companies proceeds (net) before taxation from sales of goods and services by type of activity «Other activity associated to the use of computers and information technologies» in 2008-2013, mln rubles
Diagram 45. Regional structure by proceeds of companies (net) before taxation from sales of goods and services by type of activity «Other activity associated to the use of computers and information technologies» in 2013, %
Table 78. Volumes of companies proceeds (net) before taxation from sales of goods and services by type of activity «Other activity associated to the use of computers and information technologies» in 2008 – 1 qtr. of 2014ths rubles
Schedule 67. Dynamics of profit (loss) before taxation from the beginning of the reporting year by type of activity «Other activity associated to the use of computers and information technologies» in Russia in 2008 - 2013, ths rubles
Schedule 68. Dynamics of profit (loss) before taxation from the beginning of the reporting year by type of activity «Other activity associated to the use of computers and information technologies» in Russia by quarters in 2008 - 1 qtr. of 2014ths rubles
Table 79. Volumes of profit (loss) before taxation from the beginning of the reporting year by type of activity «Other activity associated to the use of computers and information technologies» in 15 regions leading by this parameter in 2009 - 1 qtr. of 2014ths rubles
Schedule 69. Dynamics of number of personnel on the enterprises by type of activity «Other activity associated to the use of computers and information technologies» in Russia in 2009 - 1 qtr. of 2014, people
Diagram 46. Structure of number of personnel by type of activity «Other activity associated to the use of computers and information technologies» by regions in the first quarter of 2014, %
Table 80. Number of employees by type of activity «Other activity associated to the use of computers and information technologies» in 15 regions leading by this parameter in 2009 – 1 qtr. of 2014, people
Scheme 2 IT-outsourcing consumers
Diagram 47. The most demanded IT-oursourcing services by types of services in 2013, %
Schedule 70. Dynamics of investments into IT-sphere by the «Information state» program in 2014-2016, billion rubles
Table 81. Share of OGV and OMS, using Internet, in total number of the surveyed organizations OGV and OMS in 2010 - 2012, %
Diagram 48. Dynamics of rendered IT-services volume in Russia in 2011 - 2013, ths rubles.
Diagram 49. Change of structure of rendered IT-services volume in Russia by types in 2011 - 2013, %
Table 82. Volume of rendered IT services in Russia by types in 2011 - 2013, ths rubles
Diagram 50. Change of structure of rendered IT-services volume in Russia by federal districts in 2011 - 2013, %
Table 83. Volume of rendered IT services in Russia by federal districts in 2011 - 2013, ths rubles
Diagram 51. Change of structure of rendered IT-services volume in Russia by regions in 2011 - 2013, %
Table 84. Volume of rendered IT services in Russia by regions in 2011 - 2013, ths rubles
Schedule 71. Dynamics of rendered services volume by software development and consultation in this field in Russia in 2011-2013, ths rubles
Diagram 52. Change of structure of rendered services volume by software development and consultation in this field in Russia by federal districts in 2011 - 2013, %
Table 85. Volume of rendered services by software development and consultation in this field in Russia by federal districts in 2011 - 2013, ths rubles
Diagram 53. Change of structure of rendered services volume by software development and consultation in this field in Russia by regions in 2011 - 2013, %
Table 86. Volume of rendered services by software development and consultation in this field in Russia by regions in 2011 - 2013, ths rubles
Schedule 72. Dynamics of rendered services volume by creation and use of databases and information resources in Russia in 2011 - 2013, ths rubles
Diagram 54. Change of structure of rendered services volume by creation and use of databases and information resources in Russia by federal districts in 2011 - 2013, %
Table 87. Volume of rendered services by creation and use of databases and information resources in Russia by federal districts in 2011 - 2013, ths rubles
Diagram 55. Change of structure of rendered services volume by creation and use of databases and information resources in Russia by regions in 2011 - 2013, %
Table 88. Volume of rendered services by creation and use of databases and information resources in Russia by regions in 2011 - 2013, ths rubles
Schedule 73. Volume of rendered services on consultation in the field of APD and computers in Russia in 2011 - 2013, ths rubles
Diagram 56. Change of structure of rendered services volume on consultation in the field of APD and computers in Russia by federal districts in 2011 - 2013, %
Table 89. Volume of rendered services on consultation in the field of APD and computers in Russia by federal districts in 2011 - 2013, ths rubles
Diagram 57. Change of structure of rendered services volume on consultation in the field of APD and computers in Russia by regions in 2011 - 2013, %
Table 90. Volume of rendered services on consultation in the field of APD and computers in Russia by regions in 2011 - 2013, ths rubles
Schedule 74. Dynamics of rendered services volume on data processing in Russia in 2011 - 2013, ths rubles
Diagram 58. Change of structure of rendered services volume on data processing in Russia by federal districts in 2011 - 2013, %
Table 91. Volume of rendered services on data processing in Russia by federal districts in 2011 - 2013, ths rubles
Diagram 59. Change of structure of rendered services volume on data processing in Russia by regions in 2011-2013, %
Table 92. Volume of rendered services on data processing in Russia by regions in 2011 - 2013, ths rubles
Schedule 75. Dynamics of rendered services volume on technical maintenance and repair of office machines and computers in Russia in 2011 - 2013, ths rubles
Diagram 60. Change of structure of rendered services volume on technical maintenance and repair of office machines and computers in Russia by federal districts in 2011 - 2013, %
Table 93. Volume of rendered services on technical maintenance and repair of office machines and computers in Russia by federal districts in 2011 - 2013, ths rubles
Diagram 61. Change of structure of rendered services volume on technical maintenance and repair of office machines and computers in Russia by regions in 2011 - 2013, %
Table 94. Volume of rendered services on technical maintenance and repair of office machines and computers in Russia by regions in 2011 - 2013, ths rubles.
Schedule 76. Dynamics of other rendered IT-services volume in Russia in 2011 - 2013, ths rubles
Diagram 62. Change of structure other rendered IT-services volume in Russia by federal districts in 2011 - 2013, %
Table 95. Volume of other rendered IT services in Russia by federal districts in 2011 - 2013, ths rubles
Diagram 63. Change of structure other rendered IT-services volume in Russia by regions in 2011 - 2013, %
Table 96. Volume of other rendered IT services in Russia by regions in 2011 - 2013, ths rubles
Schedule 77. Dynamics of organizations costs for information and communication technologies in 2010 - 2012ths rubles
Diagram 64. Change of structure organizations costs for information and communication technologies by federal districts in 2010 - 2012ths rubles
Table 97. Organizations costs for information and communication technologies by federal districts in 2010 - 2012ths rubles
Diagram 65. Change of structure organizations costs for information and communication technologies by regions in 2010 - 2012ths rubles
Table 98. Organizations costs for information and communication technologies by regions in 2010 - 2012ths rubles
Diagram 66. Change of structure organizations costs for information and communication technologies by types of expenses in 2010 -2012, %
Table 99. Largest companies, engaged in consultation on apparatus means, by proceeds in 2008 – 2012ths rubles
Table 100. Largest companies, engaged in software development, by proceeds in 2008 – 2012ths rubles
Table 101. Largest companies, engaged in data processing, by proceeds in 2008 – 2012ths rubles
Table 102. Largest companies, engaged in databases creation, by proceeds in 2008 – 2012ths rubles
Table 103. Largest companies, engaged in technical service of office machnies and computers, by proceeds in 2008 – 2012ths rubles
Schedule 78. Dynamics of Russian IT-services export volume in 2010 -2013, mln rubles
Diagram 67. Change of structure of Russian IT-services export by countries of destination in 2010 -2013, %
Table 104. Russian export volume of IT-services by countries of destination in 2010 -2013, mln rubles
Schedule 79. Dynamics of Russian IT-services import volume in 2010-2013, mln rubles
Diagram 68. Change of structure of Russian IT-services import by countries of destination in 2010 -2013, %
Table 105. Russian import volume of IT-services by countries of destination in 2010 -2013, mln rubles
Diagram 69. Factors, influencing the decision of SaaS application
Schedule 80. Dynamics of the Russian IT-services market volume in 2011 - 2014* and forecast until 2017, billin rubles
Schedule 81. Dynamics of Russian IT-outsourcing market volume in 2011 - 2014* and forecast until 2017, billion rubles
Diagram 70. Share of IT-outsourcing on Russian IT-services market in 2011 - 2014* and forecast until 2017, %
Schedule 82. Dynamics of of Russian cloud services market volume in 2012 - 2014* and forecast until 2017, billion rubles
Diagram 71. Change of structure of Russian cloud services market in 2012 - 2014* and forecast until 2017, %
Diagram 72. Share of cloud technologies on Russian IT-services market in 2012 - 2014* and forecast until 2017, %
Table 106. Balance sheet of the company «ABSoft», ths rubles
Table 107. Financials of the company «ABSoft», ths rubles
Table 108. Financial coefficients of the company «ABSoft»
Table 109. Balance sheet of the company «LUKOIL-INFORM», ths rubles
Table 110. Cash-flow statement of the company «LUKOIL-INFORM», ths rubles
Table 111. Dynamics of financials of the company «LUKOIL-INFORM», ths rubles
Table 112. Dynamics of financial coefficients of the company «LUKOIL-INFORM»
Table 113. Subsidiaries of the company «I-Techo»
Table 114. Balance sheet of the company «I-Techo», ths rubles
Table 115. Cash-flow statement of the company «I-Techo», ths rubles
Table 116. Dynamics of financials of the company «I-Techo», ths rubles
Table 117. Dynamics of financial coefficients of the company «I-Techo»
Table 118. Balance sheet of the company «SAP CIS», ths rubles
Table 119. Cash-flow statement of the company «SAP CIS». ths rubles
Table 120. Dynamics of financials of the company «SAP CIS», ths rubles
Table 121. Dynamics of financial coefficients of the company «SAP CIS»
Table 122. Balance sheet of the company «Inline Telecom Solutions», ths rubles
Table 123. Cash-flow statement of the company «Inline Telecom Solutions», ths rubles
Table 124. Dynamics of financials of the company «Inline Telecom Solutions». ths rubles
Table 125. Dynamics of financial coefficients of the company «Inline Telecom Solutions»
ANNEX 1. LARGEST SUPPLIERS OF PRODUCTS AND SERVICES
Table 126. Largest commercial centers of data processing in Russia in 2012
Table 127. Largest suppliers of SaaSin Russia in 2012
Table 128. Largest suppliers of BI-solutions Russia in 2012
Table 129. Largest companies of Russia in information protection sphere in 2012
Table 130. Largest developers of mobile apps for business and public structures in 2013
Table 131. Largest suppliers of IT in wholesaling in 2013
Table 132. Largest suppliers of IT in public sector in 2012
Table 133. Largest suppliers of IT for banks in 2012
Table 134. Largest suppliers of IT for communication operations in 2012
Готовую работу Вы можете заказать по телефону +7 (495) 212-91-91
или оставить заявку на сайте, после чего с Вами свяжется наш менеджер.
Также Вы можете заказать разработку бизнес-плана для Вашего собственного проекта


