 +7 (499) 444-11-26 +7 (499) 444-11-26 |
Реализация инвестиционных проектов в России |
Price английской версии:
59 850 RUB
Price of English version:
1 931$
Price английской версии:
59 850 RUB
Price of English version:
1 931$
Order by phone.: +7 (495) 212-91-91
| Category: |
FAQ (payment, discounts, delivery)
![]() Order by phone.: +7 (495) 212-91-91
Order by phone.: +7 (495) 212-91-91
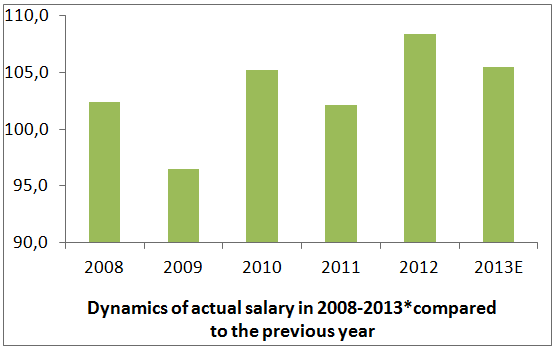
Actual salary has been increasing through the period of 2008-2013 at slower rates. The minimal growth for the surveyed period was marked in 2009, when the actual salary decreased by **%. On the background of low base parameter of the following year was high enough – **%. The maximal increase of **% was marked in 2012 . In the nearest time experts expect an increase of actual salary of **-**%.
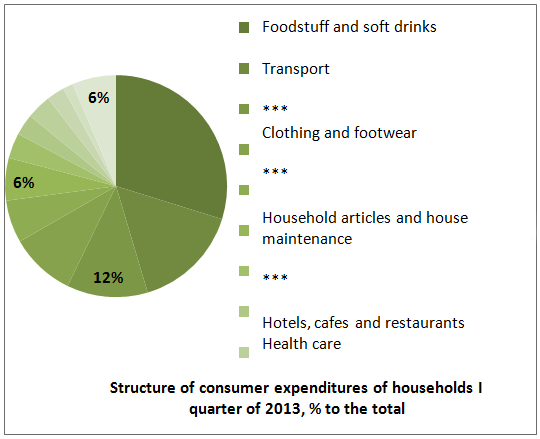
Almost one third (**%) of household consumption expenditures in the first quarter of 2013 belonged to food and soft drinks.. The next expenditure category was transport, which had **% of total expenditures. Household housing services had 11,5%, ,6% - clothes and footwear.
The consequence of the gradual recovery of consumer demand was an increase of retail trade.
Rate of growth, %
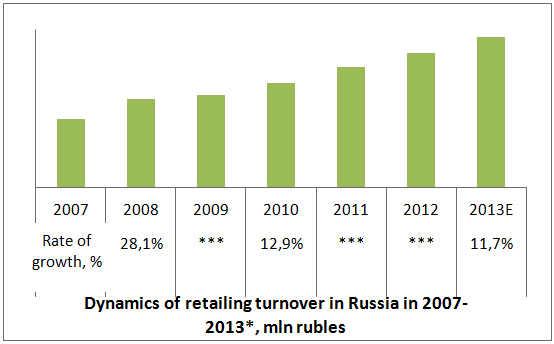
Since 2007 retailing turnover increased almost two times (from *** trl rubles to *** trl rubles). The maximal rate of growth was marked in 2008 and amounted to **%. In retail trade turnover in Russia reached almost ** trl rubles. In 2012 rate of growth slowed down to **%, the turnover reached ** trl rubles. During January-July 2013 retail trade turnover amounted to ** trl rubles.
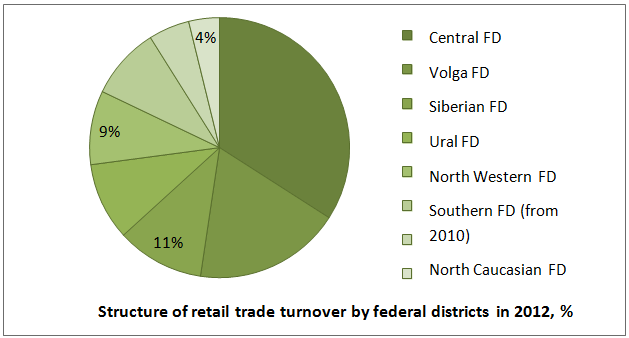
In 2011 Central FD had **% of retail trade turnover. Volga FD ranked second with two times less share – 18%. The share of Far Eastern FD was the least – 4%.
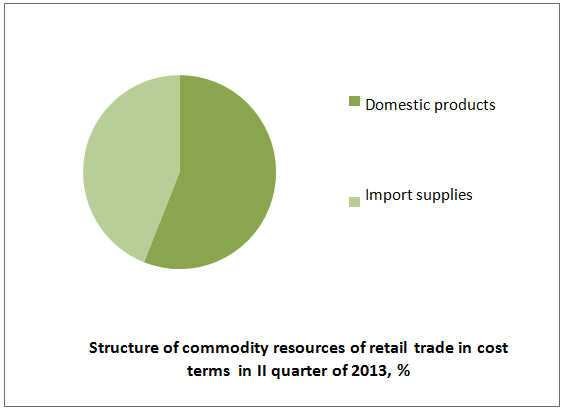
Russian retail trade in II quarter of 2013 was provided with **% of domestic products.
The largest share of imported products in 2012 was marked in the following commodity groups: *** (47,8%), milk and dry cream (**%),animal oil (**%), а and poultry and meat (**%).We should mark that the share of imported meat during last two years decreases.
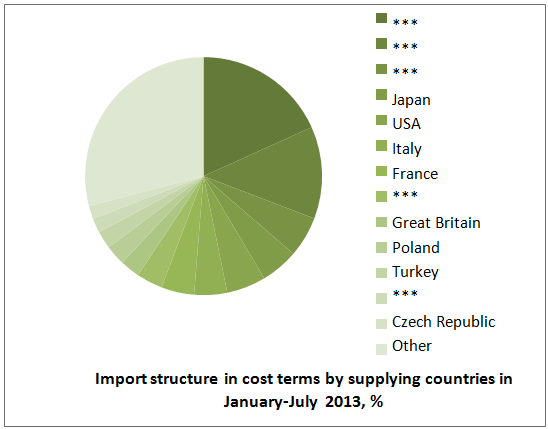
In January-July 2013 the share of ** was equal to 18% of imported products in cost terms. 13% were imported by **, shares of other countries amounted to less.
RESEARCH METHODOLOGY
LIST OF SCHEDULES, DIAGRAMS, TABLES AND SCHEMES
1. GENERAL ECONOMIC SITUATION OF RUSSIA
1.1.Population of Russia
Number of population
Largest cities
Social standard of living
Economic activity
1.2. Economic situation
Dynamics of economic development
Stability of state budget
1.3. Position of Russia in the world
Share of RF in the world population
2. SUBJECT OF RESEARCH
2.1.Characteristics of retail market
2.2.Classification of retail trade
All-Russian classification of products by types of economic activities
Classification by forms of property
Classification by types of trade
Classification by specialization
Classification by type of organization
Classification by types of trading object
Classification by forms of trading service
Classification by size and methods of trading
Classification by price policy
3. WORLD RETAIL MARKET
3.1.Dynamics of world retail trade turnover by years
3.2.World retail trade with foodstuff
3.3.Import of provisions
Dynamics of import
Structure of import
3.4.Export of provisions
Dynamics of export
Structure of export
3.5.Trends of world retail market
4. DEVELOPMENT OF RETAIL TRADE IN RUSSIA
4.1.Profits and losses of population
Average monthly salary
Money profits of population
Consumer expenses
4.2.Inflation on provision market
4.3.Consumer expectations of population
5. TURNOVER OF RUSSIAN RETAIL MARKET
5.1.Dynamics of retail trade turnover by years
5.2.Per capita turnover of retail trade
5.3.Structure of retail trade by federal districts
5.4.Structure of retailing by regions
5.5.Structure of turnover by kinds of goods
5.6.Structure of turnover by forms of property
5.7.Structure of turnover by types of organizations
6. COMMODITY STOCK
6.1.Dynamics of commodity stock by years
6.2.Structure of commodity goods
7. SHARE OF IMPORT
7.1.Structure of commodity resources of retail trade
7.2.Share of import of certain goods in commodity resources
7.3.Structure of import by supplying countries
8. RETAILING ENTERPRISES
8.1.Structure of retailing enterprises
8.2.Provision with trading objects and sales area
9. LARGEST RETAILERS
Largest trading networks by sale volume
Largest trading networks by number and size of stores
Formats of largest retailers
Reputation of trading networks
10. MAIN FMCG TRADING NETWORKS
10.1.Global networks
“METRO Cash & Carry” LLC»
“Auchan” LLC
SPAR Russia B.V. (Spar)
“Hyperglobus” LLC (Globus)
“Zelgross” LLC (REWE Group)
Billa (REWE Group) LLC
10.2.Federal networks
X5 Retail Group
“Magnit” JSC
“O`KEY” LLC
“Lenta” LLC
“DIXI Group” JSC
“Victoria” GC (sold)
“Sedmoy Continent” JSC
“Gorodskoy supermarket” LLC
“Novy Impuls – 50” LLC
“T and K Producty” JSC
Trade center “Enka” LLC
“Avoska-dva” LLC
“Mosmart” JSC
“Chain of self-service stores “Aliye Parusa” LLC
“Element-Trade” LLC
“Grinn” corporation
“Holiday” GC
“Mariya-Ra” LLC
“Noviye torgoviye sistemy” JSC
“Wester” GC
“Supermarket “Kirovsky” JSC
“Sistema regionMart” LLC
“Sibirsky gigant” LLC
“TH «Intertorg” LLC
“Lyubavushka”LLC
“Evropa” LLC
"Vivat-Trade” LLC
“Ritm -2000” LLC
“Tverskoy product” LLC
“ORT “Universam” JSC
“RegionTorg” LLC
“Forward” JSC
“Matritsa-Holding” JSC
“Salut-Torg” LLC
“Bahetle-1” LLC
“Optovik” LLC
“Kazansky trade house” JSC
“Intertorg” LLC
“Center restrukturizatsii” LLC
“Aikai” LLC
“Duplet” LLC
“Radezh” LLC
“Gulliver” JSC
“Shad” LLC
“MAN” LLC
“Pallada torg” JSC
“TVK” LLC
“Trading network Solnechny krug” LLC
“Ostap” GC
“Elite” LLC
"Lotos M” LLC
“Troyka” LLC
“Universal” GC
10.3.Associations and unions
Union of independent networks of Russia
Association of retailing companies (ARC)
11. HOUSE BRANDS OF TRADING NETWORKS
12. ONLINE RETAIL
12.1.Volume of online trade market
12.2.Methods of payment for purchases
12.3.Advantages and disadvantages of online purchases
12.4.Sale of foodstuff through the internet
Premium segment
Middle-price segment
Low-price segment
Consumers` preferences
Perspectives
13. PRICE FORMATION
13.1.Structure of retail price
13.2.Price policy
Objectives of price policy
Price strategy
Price differentiation
14. CONSUMERS` PREFERENCES
Formation of consumer loyalty
15. STATE REGULATION OF RETAIL TRADE
16. MARKET OF RETAIL PROPERTY (INFLUENCING MARKETS)
17. TRENDS ON RETAIL MARKET
18. FORECAST OF RETAIL MARKET DEVELOPMENT
ABOUT INTESCO RESEARCH GROUP
Schedule 1. Dynamics of resident population number of Russia in 1990, 2000, 2005 and 2008-2012, ths people
Schedule 2. Dynamics of population of Russia in three forecast variants in 2011-2031, ths people
Diagram 1. Structure of population of Russia by working age in 2011-2031, % (average forecast variant)
Table 1. Population number of the largest cities of Russia according to All-Russian census of 2002 and 2010 and as for January 1, 2013, ths people
Schedule 3. Dynamics of actual household disposable income of population and annual rate of growth in 2000-2012, %
Schedule 4. Dynamics of demographic load coefficient in three forecast variants in 2011-2031
Diagram 2. Dynamics of the number of employed and unemployed people in Russia in 2000-2012 and forecast for 2013-2015, mln people
Schedule 5. Dynamics of share of the unemployed in economically active population by federal districts of RF in 2006-2012, %
Schedule 6. Dynamics of GDP of Russia in prices of 2008 in 2002-2012 and forecast for2013-2015, billion rubles
Schedule 7. Investments into the fixed capital of RF in 2002-2012 and forecast for 2013-2015, billion rubles
Schedule 8. Dynamics of surplus/deficit of consolidated budget of RF in 2006-2012, % of GDP
Schedule 9. Dynamics of total external debt of RF and its share in GDP in 2009-2013 (as for 1 January), mln dollars
Diagram 3. Change of structure of external debt of RF in 2009-2013 (as for 1 January), %
Schedule 10. Dynamics of CPI in 2006-2012 and forecast for 2013-2015, % towards the previous year
Schedule 11. Dynamics of population of Russia and world in 2000-2012 and forecast up to 2100, mln people
Schedule 12. Share of RF in the world GDP in 2001-2012 and forecast for 2013-2016, %
Schedule 13. Dynamics of world retail trade volume in 2008-2011, trl. dollars.
Diagram 4. Dynamics of quantum index of retail trade by countries of the world in 2001-2011, % (in comparable prices, 2000 - basic)
Diagram 5. Dynamics of the number of retailing outlets in countries of the world in 2007-2009, as for 1000 inhabitants
Table 2. Largest companies on the world retail market by volume of retail sales in 2011
Diagram 6. Share of products in total expenditures for final consumption in countries of the world in 2012 , %
Schedule 14. Share of expenditures for health care in total expenditures for final consumption in countries of the world in 2011, %
Table 3. Structure of final consumption by countries in 2011, %
Schedule 15. Dynamics of provision import by countries in 2008-2012, mln dollars
Table 4. Dynamics of provision import by countries of the world in 2008-2011, mln dollars
Diagram 7. Structure of products import by countries in cost terms in 2011, %
Diagram 8. Change of structure of products import by countries in 2009-2011, %
Schedule 16. Dynamics of provision export by countries of the world in 2008-2011, mln dollars
Table 5. Dynamics of provision export by countries of the world in 2008-2011, mln dollars
Diagram 9. Structure of provisions export in cost terms by countries in 2011, %
Diagram 10. Change of provisions export structure by countries in 2009-2011, %
Schedule 17. Structure of provisions export by regions in 2011, %
Schedule 18. Dynamics of an average monthly nominal salary in 2008-2013*, rubles
Schedule 19. Dynamics of actual salary in 2008-2013*compared to the previous year
Schedule 20. Dynamics of money incomes in 2008-2012*, billion rubles.
Diagram 11. Structure of money incomes by receipt sources in 2012*, %
Diagram 12. Change of money incomes structure by receipt sources in 2008-2012*, %
Diagram 13. Structure of money incomes use in 2013*, %
Diagram 14. Change of money incomes use structure in 2008-2013*, %
Schedule 21. Dynamics of per capita consumer expenses in 2008- I quarter 2013, rubles/month
Diagram 15. Structure of consumer expenditures of households I quarter of 2013, % to the total
Diagram 16. Structure of expenditures for food products and alcohol free beverages in I quarter of 2013, % to the total
Schedule 22. Index of consumer prices in RF 2001 – January-July 2013, %
Schedule 23. Dynamics of consumer prices index in 2008 – January-July 2013, % towards the previous month
Schedule 24. Change of the index of consumer prices by months in 2007 - July 2013, % towards the previous month
Schedule 25. Change of the index of consumer prices by months in 2009-July 2013, % towards the corresponding period of the previous year
Diagram 17. Consumer confidence index of Russia in 1999-II quarter of 2013, (the minimal parameters of the year)
Schedule 26. Dynamics of estimations of prices changes by years (if they grow substantially or not) in 1998- January - July 2013, % of respondents
Schedule 27. Dynamics of estimations of prices changes by quarters (if they grow substantially or not) in 2006- January - July 2013, % of respondents
Schedule 28. Dynamics of economic conditions estimations (good or very good) by years in 1998- January - July 2013, % of respondents
Schedule 29. Dynamics of economic conditions estimations by years in 1998-2011(medium), % of respondents
Schedule 30. Dynamics of retailing turnover in Russia in 2007-2013*, mln rubles
Schedule 31. Dynamics of retailing turnover by months in 2008-July 2013, mln rubles
Schedule 32. Dynamics of quantum index of retail trade in Russia in 2007-1 half of 2013, compared to the previous year
Schedule 33. Dynamics of tax and due proceeds from retail trade to the budget of RF in 2008-2011, mln rubles.
Schedule 34. Dynamics of per capita retailing turnover in 2007-2012, rubles
Table 6. Dynamics of retailing turnover by federal districts in 2008-2012, mln rubles
Diagram 18. Structure of retailing turnover by federal districts in 2012, %
Diagram 19. Change of retailing turnover structure by federal districts in 2008-2012, %
Diagram 20. Dynamics of retailing turnover by federal districts in 2008-2012, mln rubles
Diagram 21. Dynamics of retailing turnover by federal districts in 2008-2012, mln rubles
Table 7. Retail trade turnover by regions of RF in 2008-2012, mln rubles
Schedule 35. Largest regions in retail trade turnover in 2012, mln rubles.
Schedule 36. Quantum index of retail trade in regions in 2012, % towards the previous year
Diagram 22. Structure of retailing turnover by regions in 2012, %
Схема 1. Оборот розничной торговли по регионам РФ в январе-июне 2012 г. (карта)
Diagram 23. Change of regional structure of retailing turnover in 2008-2012, %
Diagram 24. Change of retailing turnover structure by types of goods in 2008-2012, %
Schedule 37. Dynamics of quantum index of retail trade by groups of goods in 2007-1 half of 2013, compared to the previous year
Schedule 38. Quantum index of retail trade by kinds of provisions in regions in Russia in 1 half of 2013, % towards the previous year
Diagram 25. Dynamics of quantum index of retail trade by types of food products in 2009-1 half of 2013, compared to the previous year
Diagram 26. Structure of retailing turnover by types of food products in Russia in 2012, % to the total in actual prices
Diagram 27. Change of retailing turnover structure by types of food products in Russia in 2007-2012, % to the total in actual prices
Schedule 39. Quantum index of retail trade volume by kinds of non-foods in Russia in 1 half of 2013, % towards the previous year
Diagram 28. Dynamics of quantum index of retail trade by types of non-foods in 2009-1 half of 2013, compared to the previous year
Diagram 29. Structure of retailing of not food products by groups of goods in 2012, %
Diagram 30. Change of retailing turnover structure by types of non-foods in Russia in 2007-2012, % to the total in actual prices
Diagram 31. Structure of retailing turnover by forms of property in 2012, %
Diagram 32. Dynamics of retailing turnover by forms of property in 2008-2012, billion rubles
Diagram 33. Change of retailing turnover structure by forms of property in 2008-2012*, %
Schedule 40. Dynamics of market and fair shares in the retail trade turnover in 2007-2012, %
Schedule 41. Regions with the biggest share of markets and fairs in the overall turnover of a region in 2012, %
Diagram 34. Dynamics of market and fair shares in the retail trade turnover in federal districts in 2007-2012, %
Schedule 42. Dynamics of commodity stock in the retailing enterprises in 2007-2012 , billion rubles
Diagram 35. Structure of commodity stock of retail trade in actual prices as of the end of 2012 , %
Schedule 43. Main categories of foodstuff in the structure of commodity stock in actual prices as for the end of 2012, % to the total
Schedule 44. Main categories of non-foods in the structure of commodity stock in actual prices as for the end of 2012, % to the total
Diagram 36. Structure of commodity stock of retail trade in cost terms in II quarter of 2013, %
Diagram 37. Change of structure of commodity resources of retail trade in cost terms in 2008-II quarter of 2013, %
Table 8. Share of import of certain provisions in their commodity resources in 2009-March 2013, %
Table 9. Share of import of certain non-foods in their commodity resources in 2009-March 2013, %
Diagram 38. Largest trade partners of Russia by import volume in 2012, mln dollars
Diagram 39. Change of import structure in cost terms by supplying countries in 2007-2012, %
Diagram 40. Import structure in cost terms by supplying countries in January-July 2013, %
Diagram 41. Structure of Russian organizations specialized in retail trade in I quarter of 2013, %
Diagram 42. Structure of small and medium-sized organizations specialized in retail trade in 1 quarter 2013, %
Schedule 45. Structure of subjects of RF by the unit weight of retail trade turnover of trading networks in the overall turnover of retail trade in 2010 and 2011, number of subjects
Diagram 43. Structure of stores by types in 2011, %
Diagram 44. Structure of stores by types in 2011*, % of total shopping area
Diagram 45. Structure of universal stores by types in 2011*, %
Diagram 46. Structure of universal stores by types in 2011*, % of total shopping area
Diagram 47. Provision of the population with shopping area in 2009-2011, sq meters per 1000 people
Diagram 48. Availability of trade outlets at the end of the year in 2009-2011, ths units
Diagram 49. Availability of trade outlets at the end of the year in 2009-2011, ths square meters
Schedule 46. Structure of retail objects by formats as for November 2012
Diagram 50. Structure of new trade outlets opening in January-September 2012, % of total number
Diagram 51. Structure of new trade outlets opening in January-September 2012, % of total area
Schedule 47. Revenues volumes of the largest retailers in 2012, billion rubles
Table 10. Ranking of Russian retailers in 2012
Schedule 48. Number of sales points of the largest retailers in 2012
Table 11. Rating of the largest food retailers by the size of shopping area
Schedule 49. Size of shopping areas of the largest food retailing networks as of the end of the first half of 2012 and first half of 2013, ths square meters
Schedule 50. Number of hypermarkets of the main retailers as of July 1, 2012
Diagram 52. Change of structure of hypermarkets shopping areas in FMCG in 2011-2012, %
Schedule 51. Dynamics of number of hypermarkets in 2005-2013*, units
Schedule 52. Number of supermarkets of the main retailers as of July 1, 2012
Schedule 53. Shopping area of supermarkets of the main retailers as of July 1, 2012, ths square meters
Schedule 54. Number of discounters of the main retailers as of July 1, 2012
Schedule 55. Shopping area of discounters of the main retailers as of July 1, 2012, ths square meters
Schedule 56. Number of corner stores of the main retailers as of July 1, 2012
Schedule 57. Shopping areas of corner stores of the main retailers as of July 1, 2012, ths square meters
Diagram 53. Index of prominence in 2008 and 2010, cities with the population of less than 500 ths. ppl
Diagram 54. Index of prominence in 2008-2011, cities with the population of less than 500 ths. ppl and villages
Diagram 55. Confidence index in 2010, cities with the population of less than 500 ths. ppl
Diagram 56. Confidence index in 2008-2010, cities with the population of less than 500 ths. ppl and villages
Table 12. Operating results for 2011, X5 Retail Group
Table 13. House trademarks of trading networks
Schedule 58. Differences between prices of house brands and branded products, %
Schedule 59. Maximal share of HB in range and proceeds depending on the store format, %
Schedule 60. Share of HB in proceeds of the main retailing networks in 2011, %
Schedule 61. Share of house brands in proceeds of network discounters in Russia in 2009-2011, %
Schedule 62. Share of house brands in proceeds of network corner stores in Russia in 2009-2011, %
Schedule 63. Share of house brands in proceeds of network supermarkets in Russia in 2009-2011, %
Schedule 64. Share of house brands in proceeds of hypermarkets in Russia in 2009-2011, %
Schedule 65. Dynamics of volume of internet business in Russia in 2010-2013*, billion rubles
Diagram 57. Structure of Internet-market of electronic commerce of Russia in 2012,%
Table 14. Categories of goods whenever bought through the internet, % from those who use the internet
Table 15. Top 10 of the Russian Internet online-stores in 2012
Diagram 58. Methods of payment, % of those ordering goods online
Diagram 59. Average sum of one order, rubles, % of people buying online
Diagram 60. Disadvantages of online stores which can make people refuse its services, %
Diagram 61. Structure of the share of the Russian retailers on the Internet, % of total number of large networks
Schedule 66. The most popular categories of goods purchased online, % of people shopping online
Diagram 62. Structure of online sales of premium-class food products market in Moscow in 2011, %
Diagram 63. Structure of online sales of middle-class food products market in Moscow in 2011, %
Diagram 64. Structure of the market of food products online sales in Moscow in 2011, % of the revenues
Diagram 65. Structure of the market of food products online sales by districts of Moscow 2011, %
Table 16. Objectives of price policy
Diagram 66. Frequency of buyings, % of the number of the respondents
Diagram 67. Volume of purchases, % of the number of the respondents
Diagram 68. Favorite format of the store for everyday purchases, % of the respondents
Diagram 69. Favorite format of the store for purchases for several days, % of the respondents
Diagram 70. Factors, influencing the choice of the trade outlet according to data of the poll in November 2012, % of the respondents
Schedule 67. Dynamics of average check in 2008-2011, % by spring of 2008
Schedule 68. Dynamics of purchases frequency in 2008-2011, % by spring of 2008
Schedule 69. Dynamics of retailing turnover in Russia in 2009-2012 and forecast for 2013-2016, mln rubles
Готовую работу Вы можете заказать по телефону +7 (495) 212-91-91
или оставить заявку на сайте, после чего с Вами свяжется наш менеджер.
Также Вы можете заказать разработку бизнес-плана для Вашего собственного проекта


