 +7 (499) 444-11-26 +7 (499) 444-11-26 |
Реализация инвестиционных проектов в России |
Price английской версии:
47 850 RUB
Price of English version:
1 544$
Price английской версии:
47 850 RUB
Price of English version:
1 544$
Order by phone.: +7 (495) 212-91-91
| Category: |
FAQ (payment, discounts, delivery)
![]() Order by phone.: +7 (495) 212-91-91
Order by phone.: +7 (495) 212-91-91
RUSSIAN MARKET OF FRESH VEGETABLES
EVALUATION OF MARKET CONDITIONS AND FORECAST OF ITS DEVELOPMENT UNTIL 2020
RUSSIA
REGIONS OF RF
WORLD MARKET OF FRESH VEGETABLES
ANALYSIS OF RETAIL SALES OF FRESH VEGETABLES
VOLUME OF RUSSIAN FRESH VEGETABLES MARKET
TRENDS ON RUSSIAN MARKET OF FRESH VEGETABLES
FACTORS INFLUENCING FRESH VEGETABLES MARKET
STATE REGULATIONS OF THE MARKET
LARGEST PLAYERS ON THE MARKET OF FRESH VEGETABLES
CULTIVATED AREAS UNDER FRESH VEGETABLES
RUSSIAN PRODUCTION OF FRESH VEGETABLES
LARGEST RUSSIAN PRODUCERS OF FRESH VEGETABLES
RUSSIAN EXPORT OF FRESH VEGETABLES
RUSSIAN IMPORT OF FRESH VEGETABLES
PRODUCER PRICES FOR FRESH VEGETABLES
RETAIL PRICES FOR FRESH VEGETABLES
FORECAST OF FRESH VEGETABLES MARKET DEVELOPMENT UNTIL 2020
«Agrokombinat «Moskovskiy» JSC
«Agrokombinat «Yuzhniy» JSC
«Teplichniy kombinat «Mayskiy» LLC
«Alekseevskiy» State Unitary Agricultural enterprise
«Agrokombinat «Teplichniy» JSC
«Plemzavod»Detskoselskiy» APC
Production volumes, financial activities data, balance sheets, profit and loss statements, cash-flow statements, the subsidiaries and other data about these main companies were presented.
Federal State Statistics Service
Ministry of Economic Development of RF
Federal Custom Service
Federal Tax Service
Evaluation of Experts of the Branch
Retail sales statements
Data of the main players of the branch
Printed and electronic publications of the branch
The research contains 100 schedules, 48 diagrams, 51 tables, 7 schemes
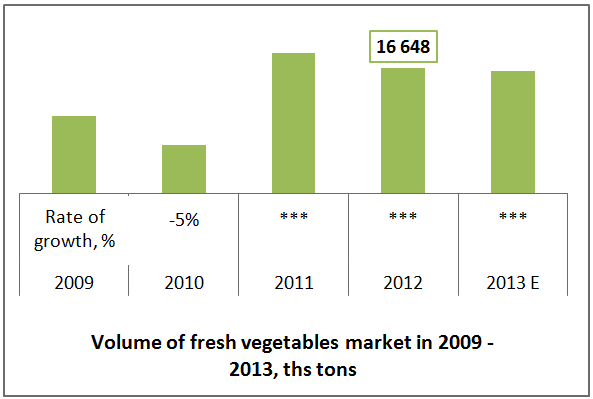
From 2009 to 2013, volume of fresh vegetables market increased by over ***%. *** parameter was reached in 2010 due to *** by over ***, and in 2011 parameter amounted to *** ths tons that was ***. In *** volume of fresh vegetables market amounted to 16,5 mln tons, that was 1% ***, than in ***.
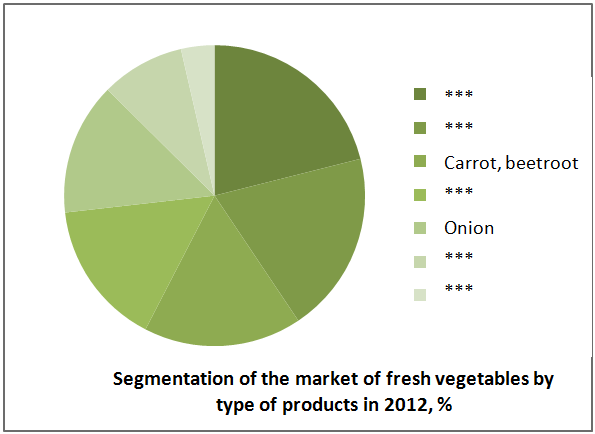
Market of fresh vegetables in Russia more than half is represented by four crops: *** (21%), *** (***%), carrot and beetroot (***%). *** also has a significant share of total volume – 14%. Russian vegetables, grown in *** have ***% of the market.
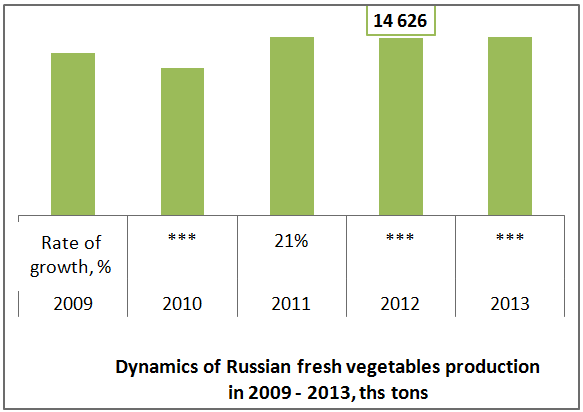
Russian vegetables production in *** suffered from unfavorable weather conditions and gross proceeds decreased by ***%. In 2011 situation improved and vegetables production increased by 21%. The past two years was marked with insignificant fluctuations however they were not less *** ths tons. Nevertheless the state program of agriculture development for 2008‑2012 affected the gross yield: in *** it exceeded parameters of 2007 by over *** mln tons. Parameter of 2013 was equal to *** ths tons.
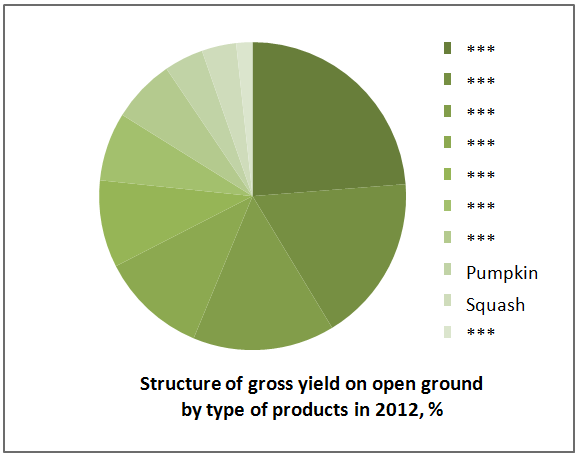
In open ground in 2012 3 crops had been grown the share of which was equal to over a half of gross yields: *** (***%), *** (18%), *** (15%). About ***% in the structure belonged to *** while other vegetables had a *** in total structure.
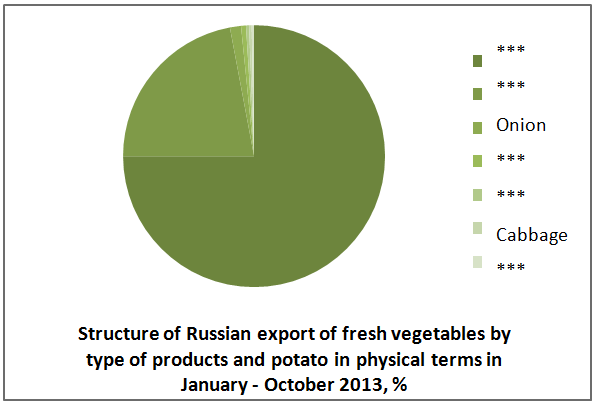
As for October 2013 *** had almost three quarters in export volumes while *** had 22% only. Slightly more than 1% belonged to onion, the remaining shares ***, ***, tomato, *** and etc.
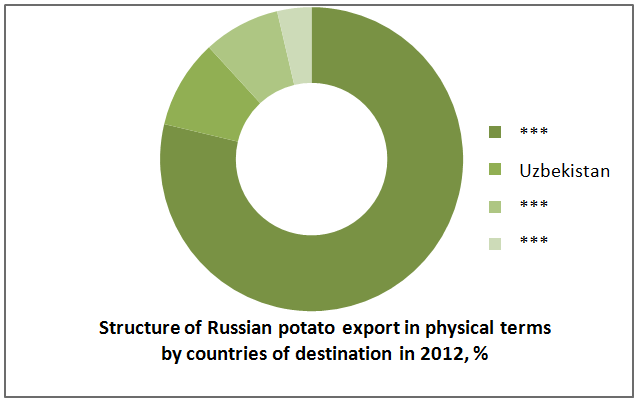
The main consumer of Russian potato in physical terms in 2012 was ***, which had 4/5 of all potato supplied by Russia to foreign markets, Uzbekistan and *** followed it with ***% and ***% respectively.
The main component of Russian import in 2012 was *** (30%), Egyptian potato (***%), *** (***%)and other vegetables from Israel and Poland (***%).
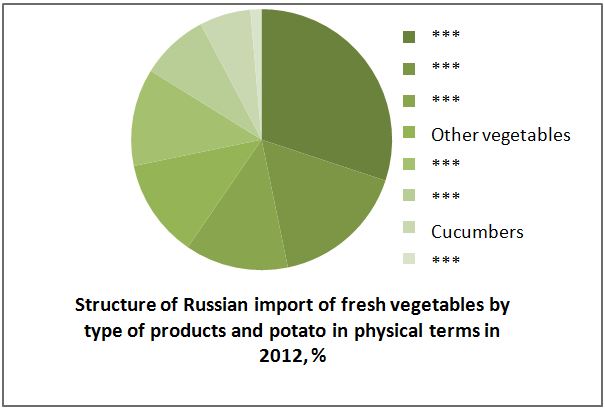
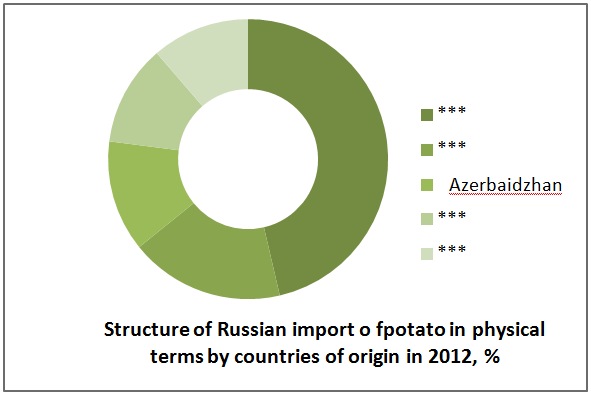
One fifth of all potato import in 2012 belonged to ***, and from 11% to 13% of the volume were imported from ***, Holland and ***. All these suppliers satisfied more than half of the Russian demand for potato.
RESERCH METHODOLOGY
LIST OF SCHEDULES, DIAGRAMS AND TABLES
1. GENERAL ECONOMIC SITUATION IN RUSSIA
1.1. Population of Russia
Dynamics of population
Largest cities
Social standards of living dynamics
Economic activity
1.2. Economic situation
Dynamics of economy development
Stability of the state budget
1.3. Position of Russia in the world
Share of RF in the world population
2. SUBJECT OF RESEARCH
2.1. Definition
2.2. Classification
All-Russian Classification of Economic Activities and Products
Russian National Classifier of Economic Activities
Commodity Nomenclature of Foreign Economic Activity
Other classifications
3. WORLD MARKET OF FRESH VEGETABLES
3.1. Cultivated areas
Dynamics of cultivated areas
Structure of cultivated areas
3.2. Production of vegetables
Dynamics of production
Structure of production
3.3. Production of tomatoes
Dynamics of production
Structure of production
3.4. Production of onion
Dynamics of production
Structure of production
3.5. Production of potato
Dynamics of production
Structure of production
4. ANALYSIS OF RETAIL SALES OF FRESH VEGETABLES
4.1. Dynamics of retail sales by years
4.2. Dynamics of retail sales by quarters
4.3. Structure of retail sales by federal districts
4.4. Largest regions of RF by retail sales
5. VOLUME OF RUSSIAN MARKET OF FRESH VEGETABLES
5.1. Dynamics of market volumes by years
5.2. Import content on the market
5.3. Per capita consumption
5.4. Segmentation of the market
6. TRENDS ON RUSSIAN MARKET OF FRESH VEGETABLES
7. FACTORS INFLUENCING FRESH VEGETABLES MARKET
8. STATE REGULATIONS OF THE MARKET
9. LARGEST PLAYERS ON FRESH VEGETABLES MARKET
10. CULTIVATED AREAS UNDER FRESH VEGETABLES
10.1. Dynamics of cultivated areas under vegetables
10.2. Dynamics of areas under glass by years
11. RUSSIAN PRODUCTION OF FRESH VEGETABLES
11.1. Dynamics of production volumes by years
11.2. Dynamics of production volumes by months
11.3. Structure of production by type of products
11.4. Production volumes by federal districts of RF
11.5. Structure of production by federal districts of RF
11.6. Production volumes in regions of RF
11.7. Regional production structure
12. LARGEST RUSSIAN PRODUCERS OF FRESH VEGETABLES
12.1. By proceeds volume
13. RUSSIAN EXPORT OF FRESH VEGETABLES
13.1. Total export
Export dynamics by years
Export dynamics by months
Export structure
13.2. Export of potato
Export dynamics by years
Export dynamics by months
Export structure
13.3. Export of other vegetables
Export dynamics by years
Export dynamics by months
Export structure
14. RUSSIAN IMPORT OF FRESH VEGETABLES
14.1. Total import
Import dynamics by years
Import dynamics by months
Import structure
14.2. Import of tomatoes
Import dynamics by years
Import structure
14.3. Import of potato
Import dynamics by years
Import structur
14.4. Import of onion
Import dynamics by years
Import structure
14.5. Import of other vegetables
Import dynamics by years
Import structure
15. PRODUCER PRICES FOR FRESH VEGETABLES
15.1. Dynamics of producer prices by years
15.2. Dynamics of producer prices by months
16. RETAIL PRICES FOR FRESH VEGETABLES
16.1. Dynamics of retail prices by years
16.2. Dynamics of retail prices by months
17. FORECAST OF FRESH VEGETABLES MARKET DEVELOPMENT UNTIL 2020
18. PROFILES OF THE LARGEST ENTERPRISES
18.1. «Agrokombinat «Moskovskiy» JSC
Reference information
Types of activity
Subsidiaries
Production volumes
Balance sheet
Profit and loss statement
Cash flow statement
Financials
18.2. «Agrokombinat «Yuzhniy» JSC
Reference information
Types of activity
Subsidiaries
Production volumes
Balance sheet
Profit and loss statement
Cash flow statement
Financials
18.3. «Teplichniy kombinat «Mayskiy» LLC
Reference information
Types of activity
Subsidiaries
Balance sheet
Profit and loss statement
Cash flow statement
Financials
18.4. «Alekseevskiy» State Unitary Agricultural enterprise
Reference information
Types of activity
Subsidiaries
Production volumes
Balance sheet
Profit and loss statement
Cash flow statement
Financials
18.5. «Agrokombinat «Teplichniy» JSC
Reference information
Types of activity
Subsidiaries
Production volumes
Balance sheet
Profit and loss statement
Cash flow statement
Financials
18.6. «Plemzavod»Detskoselskiy» APC
Reference information
Types of activity
Subsidiaries
Production volumes
Balance sheet
Profit and loss statement
Cash flow statement
Financials
ABOUT INTESCO RESEARCH GROUP
Schedule 1. Dynamics of resident population number of Russia in 1990, 2000, 2005 and 2008-2012, ths people
Schedule 2. Dynamics of population of Russia in three forecast variants in 2011-2031, ths people
Diagram 1. Structure of population of Russia by working age in 2011-2031, % (average forecast variant)
Table 1. Number of population in largest cities of Russia according to Census of 2002 and 2010 and as for January1, 2013, ths people
Schedule 3. Dynamics of actual household disposable income of population and annual rate of growth in 2000-2012, %
Schedule 4. Dynamics of demographic load coefficient in three forecast variants in 2011-2031
Diagram 2. Dynamics of the number of employed and unemployed people in Russia in 2000-2012 and forecast for 2013-2015, mln people
Schedule 5. Dynamics of share of the unemployed in economically active population by federal districts of RF in 2006-2012, %
Schedule 6. Dynamics of GDP of Russia in prices of 2008 in 2002-2012 and forecast for2013-2015, billion rubles
Schedule 7. Investments into the fixed capital of RF in 2002-2012 and forecast for 2013-2015, billion rubles
Schedule 8. Dynamics of surplus/deficit of consolidated budget of RF in 2006-2012, % of GDP
Schedule 9. Dynamics of total external debt of RF and its share in GDP in 2009-2013 (as for 1 January), mln dollars
Diagram 3. Change of structure of external debt of RF in 2009-2013 (as for 1 January), %
Schedule 11. Dynamics of population of Russia and world in 2000-2012 and forecast up to 2100, mln people
Schedule 12. Share of RF in the world GDP in 2001-2012 and forecast for 2013-2016, %
Scheme 1. Classification of tomatoes
Scheme 2. Classification of cucumbers
Scheme 3. Other classifications of vegetables
Scheme 4. Types of vegetative vegetables
Scheme 5. Types of fruited vegetables
Schedule 13. Dynamics of cultivated areas under vegetables, in the world
in 2008-2012, ths ha
Schedule 14 Dynamics of cultivated areas, under potato, in the world
in 2008-2012, ths ha
Diagram 4. Structure of cultivated areas under vegetables, by type of products in the world in 2012, %
Diagram 5. Structure of cultivated areas under vegetables, in the world by countries in 2012, %
Diagram 6 Structure of cultivated areas, under potato, by countries in 2012, %
Schedule 15. Dynamics of world vegetables production in 2008 - 2012, ths tons
Diagram 7. Structure of world vegetables production by type of products
in 2012, %
Diagram 8 Structure of world vegetables production by countries in 2012, %
Schedule 16. Dynamics of world tomato production in 2008 - 2012, ths tons
Table 2. Structure of world tomato production by countries in 2008 - 2012, ths tons
Diagram 9. Structure of world tomato production by countries in 2012, %
Diagram 10. Change of structure of world tomato production by countries
in 2008 - 2012, %
Schedule 17. Dynamics of world onion production in 2008 - 2012, ths tons
Table 3. Structure of world onion production by countries in 2008 - 2012, ths tons
Diagram 11. Structure of world onion production by countries in 2012, %
Diagram 12. Change of structure of world onion production by countries
in 2008 - 2012, %
Schedule 18. Dynamics of world potato production in 2008 - 2012, ths tons
Table 4. Structure of world potato production by countries in 2008 - 2012, ths tons
Diagram 13. Structure of world potato production by countries in 2012, %
Diagram 14. Change of structure of world potato production by countries
in 2008 - 2012, %
Schedule 19. Dynamics of retail sales of fresh vegetables in 2009 - 2013*, billion rubles
Schedule 20 Dynamics of potato retail sales in 2009 - 2013*, billion rubles
Schedule 21. Dynamics of fresh vegetables share in turnover structure
in 2005 - 2013*, %
Schedule 22 Dynamics of potato share in turnover structure in 2005 - 2013*, %
Schedule 23. Dynamics of retail sales of fresh vegetables by quarters
in 2012 - 2013, billion rubles
Schedule 24 Dynamics of potato retail sales by quarters in 2012 - 2013*, billion rubles
Table 5. Volumes of fresh vegetables retail sales by federal districts
in 2012 – January - September 2013, billion rubles
Table 6 Volumes of potato retail sales by federal districts in 2012 – January – September 2013, billion rubles
Diagram 15. Structure of retail sales of fresh vegetables by federal districts in January – September 2013, %
Diagram 16 Structure of potato retail sales by federal districts in January - September 2013, %
Table 7. Volumes of fresh vegetables retail sales by regions in 2012 – January - September 2013, billion rubles
Table 8 Volumes of potato retail sales by regions in 2012 - January – September 2013, billion rubles
Diagram 17. Structure of retail sales of fresh vegetables by regions
in January - September 2013, %
Diagram 18 Structure of potato retail sales by regions in January - September 2013, %
Schedule 25 Dynamics of fresh vegetables market volume in 2009 - 2013*, ths tons
Schedule 26 Dynamics of potato market volume in 2009 - 2013*, ths tons
Diagram 19 Import content on the market of fresh vegetables in 2013*, %
Diagram 20 Import content on potato market in 2013*, %
Schedule 27 Dynamics of import content on the market of fresh vegetables in 2009-2013*, %
Schedule 28 Dynamics of import content on potato market in 2009-2013*, %
Schedule 29 Dynamics of per capita fresh vegetables consumption
in 2009 - 2013*, kg/person
Schedule 30 Dynamics of per capita potato consumption in 2009 - 2013*, kg/person
Diagram 21 Segmentation of the market of fresh vegetables by type of products in 2012, %
Schedule 31 Change of fresh vegetables market segmentation by type of products
in 2009 - 2012, %
Schedule 32. Provisions of population with main types of vegetables in Russia in 2012, %
Table 9. Operating capabilities of greenhouse centers
Schedule 33 Dynamics of cultivated areas under vegetables and share of vegetables in total cultivated area in 2009 - 2013, ths ha
Schedule 34 Dynamics of cultivated areas under potato and share of potato in total cultivated area in 2009 - 2013, ths ha
Scheme 6. Map of distribution of cultivated areas under vegetables on the territory of the country in 2013
Scheme 7. Map of distribution of cultivated areas, under potato, on the territory of the country in 2013
Schedule 35 Dynamics of heated houses area in Russia in 2009 – January-September 2013, ths ha
Schedule 36 Dynamics of commissioning (due to construction and reconstruction) of total amount of greenhouse centers, film greenhouses and greenhouses under glass by years in 2009 – January - September 2013, ha
Schedule 37 Change of structure of commissioning (due to construction and reconstruction) of greenhouse centers, film greenhouses and greenhouses under glass by types of objects in 2009 – January-September 2013, ha
Schedule 38 Change of structure of commissioning (due to construction and reconstruction) of greenhouse centers, film greenhouses and greenhouses under glass by federal districts in 2009 – January - September 2013, ha
Schedule 39 Dynamics of Russian vegetables production in 2009 - 2013, ths tons
Schedule 40 Dynamics of Russian potato production in 2009 - 2013, ths tons
Schedule 41 Dynamics of Russian vegetables production by months in 2012 - 2013, ths tons
Schedule 42 Dynamics of Russian potato production by months
in 2012 - 2013, ths tons
Diagram 22 Structure of gross yield of field vegetables by type of products in 2012, %
Schedule 43 Change of structure of gross yield of field vegetables by type of products in 2008-2012, %
Table 10. Production volumes of fresh vegetables by federal districts in 2009 - 2013, ths tons
Table 11 Volumes of potato production by federal districts in 2009 - 2013, ths tons
Diagram 23. Structure of Russian vegetables production by federal districts in 2013, %
Diagram 24 Structure of Russian potato production by federal districts in 2013, %
Diagram 25. Change of structure of Russian vegetables production
by federal districts in 2009 - 2013, %
Diagram 26 Change of structure of Russian potato production
by federal districts in 2009 - 2013, %
Table 12. Production volumes of fresh vegetables by regions in 2009 – 2013, ths tons
Table 13. Volumes of potato production by regions in 2009 - 2013, ths tons
Diagram 27. Structure of Russian vegetables production by regions in 2013, %
Diagram 29. Change of structure of Russian vegetables production by regions in 2009 - 2013, %
Diagram 30 Change of structure of Russian potato production
by regions in 2009 - 2013, %
Table 14. Proceeds of the largest vegetables producers in 2008-2012, ths rubles
Diagram 31. Structure of proceeds of vegetables growing industry by largest enterprises in 2012, %
Diagram 32 Structure of proceeds of vegetables growing industry by regions in 2012, %
Schedule 44 Dynamics of Russian export of fresh vegetables and potato in physical terms by years in 2009 - 2013*, tons
Schedule 45 Dynamics of Russian export of fresh vegetables and potato in cost terms in 2009 - 2013*, ths dollars
Schedule 46 Dynamics of Russian export of fresh vegetables and potato in physical terms by months in 2011 - January - October 2013, tons
Schedule 47 Dynamics of Russian export of fresh vegetables and potato in money terms by months in 2011 - January - October 2013, ths dollars
Diagram 33 Structure of Russian export of fresh vegetables by type of products and potato in physical terms in January - October 2013, %
Diagram 34 Structure of Russian export of fresh vegetables by type of products and potato in cost terms in January - October 2013, %
Schedule 48 Change of structure of Russian export of fresh vegetables by type of products and potato in physical terms in 2009 - January - October 2013, %
Schedule 49 Change of structure of Russian export of fresh vegetables by type of products and potato in cost terms in 2009 - January - October 2013, %
Schedule 50. Dynamics of Russian potato export in physical terms by years in 2009 - 2013*, tons
Schedule 51. Dynamics of Russian potato export in cost terms by years in 2009 - 2013*, ths dollars
Schedule 52. Dynamics of Russian potato export in physical terms by months in 2011 - January - October 2013, tons
Schedule 53. Dynamics of Russian potato export in money terms by months in 2011 - January - October 2013, ths dollars
Diagram 35. Structure of Russian potato export in physical terms by countries of destination in 2012, %
Diagram 36. Structure of Russian potato export in cost terms by countries of destination in 2012, %
Schedule 54 Change of structure of Russian potato export in physical terms by countries of destination in 2009 - 2012, %
Schedule 55 Change of structure of Russian potato export in cost terms by countries of destination in 2009 - 2012, %
Schedule 56 Dynamics of Russian other vegetables export in physical terms by years in 2009 - 2013*, tons
Schedule 57 Dynamics of Russian other vegetables export in cost terms by years in 2009 - 2013*, ths dollars
Schedule 58 Dynamics of Russian other vegetables export in physical terms by months in 2011 - January - October 2013, tons
Schedule 59. Dynamics of Russian other vegetables export in cost terms by months in 2011 - January - October 2013, ths dollars
Diagram 37. Structure of Russian other vegetables export in physical terms by countries of destination in 2012, %
Diagram 38. Structure of Russian other vegetables export in cost terms by countries of destination in 2012, %
Schedule 60 Change of structure of Russian other vegetables export in physical terms by countries of destination in 2009 - 2012, %
Schedule 61 Change of structure of Russian other vegetables export in cost terms by countries of destination in 2009 - 2012, %
Schedule 62 Dynamics of Russian import of fresh vegetables and potato in physical terms in 2009 - 2013*, tons
Schedule 63 Dynamics of Russian import of fresh vegetables and potato in cost terms in 2009 - 2013*, ths dollars
Schedule 64 Dynamics of Russian import of fresh vegetables by type of products and potato in physical terms by months in 2009 - January - October 2013, tons
Schedule 65 Dynamics of Russian import of fresh vegetables by type of products and potato in cost terms by months in 2009 - January - October 2013, ths dollars
Diagram 39 Structure of Russian import of fresh vegetables by type of products and potato in physical terms in 2012, %
Diagram 40 Structure of Russian import of fresh vegetables by type of products and potato in cost terms in 2012, %
Schedule 66 Change of structure of Russian import of fresh vegetables by type of products and potato in physical terms in 2009 - January - October 2013, %
Schedule 67 Change of structure of Russian import of fresh vegetables by type of products and potato in cost terms in 2009 - January - October 2013, %
Schedule 68 Dynamics of Russian tomato import in physical terms in 2009–2013*, tons
Schedule 69 Dynamics of Russian tomato import in cost terms in 2009 - 2013*, ths dollars
Diagram 41 Structure of Russian tomato import in physical terms by countries of origin in 2012, %
Diagram 42 Structure of Russian tomato import in cost terms by countries of origin in 2012, %
Schedule 70 Change of structure of Russian tomato import in physical terms by countries of origin in 2009 - 2012, %
Schedule 71 Change of structure of Russian tomato import in cost terms by countries of origin in 2009 - 2012, %
Schedule 72 Dynamics of Russian potato import in physical terms in 2009 - 2013*, tons
Schedule 73 Dynamics of Russian potato import in cost terms in 2009 - 2013*, ths dollars
Diagram 43 Structure of Russian potato import in physical terms by countries of origin in 2012, %
Diagram 44 Structure of Russian potato import in cost terms by countries of origin in 2012, %
Schedule 74 Change of structure of Russian potato import in physical terms by countries of origin in 2009 - 2012, %
Schedule 75 Change of structure of Russian potato import in cost terms by countries of origin in 2009 - 2012, %
Schedule 76 Dynamics of Russian onion import in physical terms
in 2009 - 2013*, tons
Schedule 77 Dynamics of Russian onion import in cost terms in 2009 - 2013*, ths dollars
Diagram 45 Structure of Russian onion import in physical terms by countries of origin in 2012, %
Diagram 46 Structure of Russian onion import in cost terms by countries of origin in 2012, %
Schedule 78 Change of structure of Russian onion import in physical terms by countries of origin in 2009 - 2012, %
Schedule 79 Change of structure of Russian onion import in cost terms by countries of origin in 2009 - 2012, %
Schedule 80 Dynamics of Russian other vegetables import in physical terms in 2009 - 2013*, tons
Schedule 81 Dynamics of Russian other vegetables import in cost terms in 2009 - 2013*, ths dollars
Diagram 47 Structure of Russian other vegetables import in physical terms by countries of origin in 2012, %
Diagram 48 Structure of Russian other vegetables import in cost terms by countries of origin in 2012, %
Schedule 82 Change of structure of Russian other vegetables import in physical terms by countries of origin in 2009 - 2012, %
Schedule 83 Change of structure of Russian other vegetables import in cost terms by countries of origin in 2009 - 2012, %
Schedule 84. Dynamics of producer prices for fresh cucumbers by years in 2009 - 2013, rub/ton
Schedule 85. Dynamics of producer prices for fresh tomato by years in 2009 - January - November 2013, rub/ton
Schedule 86 Dynamics of producer prices for potato in 2009 - 2013, rub/ton
Schedule 87 Dynamics of producer prices for fresh cucumbers by months
in 2009 - 2013, rub/ton
Schedule 88. Dynamics of producer prices for fresh tomato by months
in 2009 - 2013, rub/ton
Schedule 89 Dynamics of producer prices for potato by months in 2009 - 2013, rub/ton
Table 15 Average producer prices for fresh cucumbers by regions in 2012 - January - November 2013, rub/ton
Table 16 Average producer prices for fresh tomato by regions in 2012 - January - November 2013, rub/ton
Table 17 Average producer prices for potato by regions in 2012 - 2013, rub/ton
Schedule 90. Dynamics of retail prices for fresh cucumbers by years in 2009 - 2013, rub/kg
Schedule 91. Dynamics of retail prices for fresh tomato by years in 2009 - 2013, rub/kg
Schedule 92 Dynamics of retail prices for potato by years in 2009 - 2013, rub/kg
Schedule 93 Rate of growth of retail prices for fresh vegetables, potato and other products by years in 2009 - 2013, %
Schedule 94. Dynamics of retail prices for fresh cucumbers by months in 2009 - 2013, rub/kg
Schedule 95. Dynamics of retail prices for fresh tomato by months
in 2009 - 2013, rub/kg
Schedule 96 Dynamics of retail prices for potato by months in 2009 - 2013, rub/kg
Table 18 Average retail prices for fresh cucumbers by regions in 2012 - 2013, rub/kg
Table 19 Average retail prices for fresh tomato by regions in 2012 - 2013, rub/kg
Table 20 Average retail prices for potato by regions in 2012 - 2013, rub/kg
Schedule 97. Dynamics of protected ground area in Russia in 2009 – 2020*, ths ha
Schedule 98 Dynamics of protected ground vegetables production in 2009 – 2020*, ths tons
Schedule 99 Gross yield of vegetables (open and protected ground) at 5% rate of growth in 2009 - 2020*, ths tons
Schedule 100 Gross yield of vegetables (open and protected ground) at 3,5% rate of growth in 2009 - 2020*, ths tons
Table 21. Production volumes of «Agrokombinat «Moskovskiy» JSC in 2006 – 2009
Table 22. Balance sheet of «Agrokombinat «Moskovskiy» JSC in 2009 - January - December 2013, ths rubles
Table 23 Profit and loss statement of «Agrokombinat «Moskovskiy» JSC in 2009 - January - December 2013, ths rubles
Table 24. Cash flow statement of «Agrokombinat «Moskovskiy» JSC in 2009 - 2012, ths rubles
Table 25. Financials of «Agrokombinat «Moskovskiy» JSC in 2009 - 2013
Table 26. Production volumes of Agricultural complex «Yuzhniy» JSC
in 2006 – 2009
Table 27. Balance sheet of «Agrokombinat «Yuzhniy» JSC in 2009 – 2012, ths rubles
Table 28. Profit and loss statement of Agricultural complex «Yuzhniy» JSC in 2009 - 2012, ths rubles
Table 29 Cash flow statement of «Agrokombinat «Yuzhniy» JSC in 2009 – 2012, ths rubles
Table 30. Financials of «Agrokombinat «Yuzhniy» JSC in 2008 – 2012
Table 31. Balance sheet of «Teplichniy kombinat «Mayskiy» LLC in 2009 – 2012, ths rubles
Table 32. Profit and loss statement of «Teplichniy kombinat «Mayskiy» LLC in 2009 - 2012, ths rubles
Table 33 Cash flow statement of «Teplichniy kombinat «Mayskiy» LLC in 2009 - 2012, ths rubles
Table 34. Financials of «Teplichniy kombinat «Mayskiy» LLC in 2008 – 2012
Table 35. Production volumes of «Alekseevskiy» State Unitary Agricultural enterprise
in 2006 – 2009
Table 36. Balance sheet of «Alekseevskiy» State Unitary Agricultural enterprise in 2009 - 2012, ths rubles
Table 37. Profit and loss statement of «Alekseevskiy» State Unitary Agricultural enterprise in 2009 - 2012, ths rubles
Table 38 Cash flow statement of «Alekseevskiy» State Unitary Agricultural enterprise
in 2010 - 2012, ths rubles
Table 39. Financials of «Alekseevskiy» State Unitary Agricultural enterprise
in 2008 - 2012
Table 40. Subsidiaries of «Voronezhskiy Teplichniy Kombinat» PC
Table 41. Production volumes of «Agrokombinat «Teplichniy» JSC in 2006 - 2009
Table 42. Balance sheet of «Agrokombinat «Teplichniy» JSC in 2009- 2012, ths rubles
Table 43 Profit and loss statement of «Agrokombinat «Teplichniy» JSC
in 2009 - 2012, ths rubles
Table 44. Cash flow statement of «Agrokombinat «Teplichniy» JSC in 2009 - 2012, ths rubles
Table 45. Financials of «Agrokombinat «Teplichniy» JSC in 2008 - 2012.
Table 46. Subsidiaries of «Voronezhskiy Teplichniy Kombinat» PC
Table 47. Production volumes of «Plemzavod»Detskoselskiy» APC in 2006 - 2009
Table 48. Balance sheet of «Plemzavod»Detskoselskiy» APC in 2009 – 2012, ths rubles
Table 49 Profit and loss statement of «Plemzavod»Detskoselskiy» APC
in 2009 - 2012, ths rubles
Table 50 Cash flow statement of «Plemzavod»Detskoselskiy» APC in 2009 - 2012, ths rubles
Table 51. Financials of «Plemzavod»Detskoselskiy» APC in 2008 - 2012
Готовую работу Вы можете заказать по телефону +7 (495) 212-91-91
или оставить заявку на сайте, после чего с Вами свяжется наш менеджер.
Также Вы можете заказать разработку бизнес-плана для Вашего собственного проекта


