 +7 (499) 444-11-26 +7 (499) 444-11-26 |
Реализация инвестиционных проектов в России |
Price английской версии:
52 350 RUB
Price of English version:
1 689$
Price английской версии:
52 350 RUB
Price of English version:
1 689$
Order by phone.: +7 (495) 212-91-91
| Category: |
FAQ (payment, discounts, delivery)
![]() Order by phone.: +7 (495) 212-91-91
Order by phone.: +7 (495) 212-91-91
ENERGY SAVING AND RUSSIAN MARKET OF ENERGY SAVING IN THE AREA OF ELECTRICITY AND GAS SUPPLY
EVALUATION OF THE MARKET AND FORECAST OF ITS DEVELOPMENT FOR 2014-2016
RUSSIA
REGIONS OF RF
INDICATORS OF PRODUCTION, DISTRIBUTION OF ELECTRICITY, GAS AND WATER
ENERGY RESOURCES BALANCE
ELECTRICITY CONSUMPTION AND PRODUCTION BALANCE IN RUSSIA
FUEL ENERGY PRODUCTION
LARGEST POWER GENERATING COMPANIES
TARIFFS FOR ELECTRICITY AND GAS SUPPLY
STATE REGULATION OF ENERGY MARKET
FACTORS HINDERING THE MARKET DEVELOPMENT
FORECAST OF ENERGY SAVING MARKET DEVELOPMENT FOR 2014-2016
FGC UES
Inter RAO UES
Mosenergo OJSC (Gazprom Group)
Information about the main enterprises’ production volume, financials of activity, balance sheet, profit and loss statements, cash flow statements, subsidiaries and some other information is also presented.
Federal State Statistics Service
Ministry of Economic Development of RF
RF Ministry of Energy
Ministry of Regional Development of RF
Federal Tax Service
Industry experts’ estimates
Federal target programs and subprograms
Printed and electronic publications of the branch
Data of state structures (ministries and agencies), industry associations, unions, dealing with the development of construction and building industry
E – estimate
P – forecast
* - estimate of forecast
The research contains 29 schedules, 12 diagrams, 38 tables and 3 schemes.
In 2012 production and distribution of electricity, gas and water increased by **%, what is slightly higher than that of the previous year (100,1%).
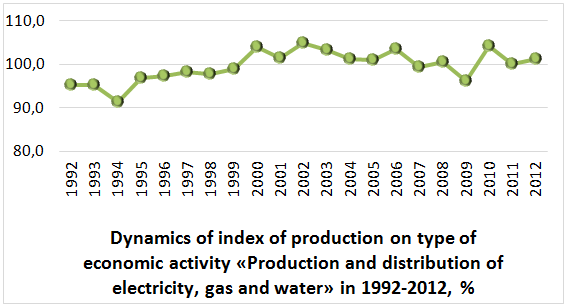
The minimum number was recorded in 1994 – **%, the maximum one – in 2002 – 104,8%. Relatively high growth rates were also observed in 2010 – 1**%.
In 2013 the predicted increase in revenue from the production, transmission and distribution of electricity by **%, is awaited, consequently the index will amount to ** 34,8 bln. rub. In the previous years there was a negative dynamics by 1,8%.
Except for 2012 the changes in the sales dynamics from activities of production, transmission and distribution of electricity is characterized as rising ones, tending to a gradual reduction of the growth rates.
The main consumers of gas are: manufacturing (**%),industrial production (*1,9%) and population (**,8%). Final consumption of fuel processing products by **,1% in 2011 was also formed by the above groups in 2011. Manufacturing accounted for about *5% in the structure of energy consumption, the population accounted for less than 10% of demand. At the same time, the latter group accounted for *9,2% in the consumption of heat power.
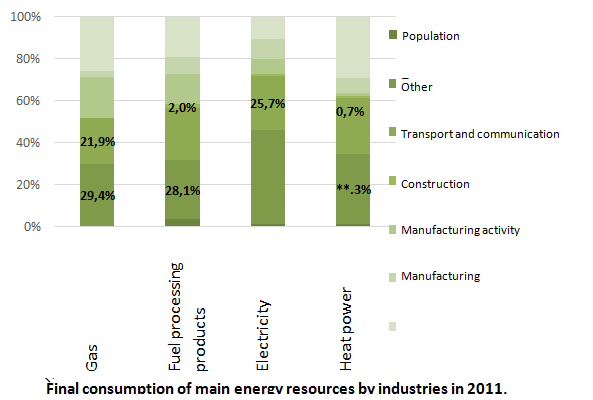
Transformation into other kinds of energy accounts for the large amount in the structure of fuel natural gas consumption (more than 40% of the total resource volume).
The most energy-intensive industry is the metallurgic production of fabricated metal products – *0,8% in consumption of fossil fuels by manufacturing industries, and also production of other non-metal mineral products – 30% in the same structure.
In the process of energy resources transportation and consumption the share of losses amounted to *,2 in 20122, electricity – **,1%. Oil and gas losses were considerably small – *.4% and *,8% respectively.
ELECTRICITY CONSUMPTION AND PRODUCTION BALANCE IN RUSSIA
Most of the total volume of electricity consumption is lost in the Republic of Ingushetia (48%). The losses are also big in the Republic of Tuva (39,2%), the Chechen Republic (34,5%) and the Republic of Dagestan (32,9%). More than one fourth of the consumed electricity is lost in North Ossetia, the Republics of Adygea, Altai, Kalmykia, Kabardino-Balkaria.

In the regions of the North Caucasus Federal District the situation is particularly severe and the problems with worn-out electric equipment are of crisis character.
In Russia today, there is a significant physical and technological deterioration of networks. According to the Ministry of Energy, «the share of distribution networks that have fulfilled their standard period amounts to **%, of the networks are in the middle of the standard period. The overall deterioration of distribution network amounts to *0%».
It should be emphasized that the state power grid assets in Russia is much worse than in other major countries, where the rate of deterioration is 27-44%. Besides, the modern equipment, providing high reliability and lower operating costs, yet are not widely used in the Russian ESCs.
The average age of the main power plant equipment at the beginning of 2011 amounted to more than 32 years, including in HPP - 36 years, TPP - 31 years old, NPP - 25 years. The average age of technological equipment of the grid complex is about 40 years.
RESEARCH METHODOLY
LIST OF SCHEDULES, DIAGRAMS, TABLES AND SCHEMES
1. GENERAL ECONOMIC SITUATION IN RUSSIA
1.1. Population in Russia
Population size
The largest cities
Social standard of living
Economic activity
1.2. Economic situation
Dynamics of economic development
Stability of state budget
1.3. International Russian position
RF share in the population of the world
2. SUBJECT OF RESEARCH
2.1. Types of energy resources
Types of energy resources
Methods of energy consumption
2.2. Classification as per All-Russian Classification of Products on types of economic activities
3. INDICATORS OF PRODUCTION, DISTRIBUTION OF ELECTRICITY, GAS AND WATER
3.1. Index of production and distribution of electricity, gas and water
3.2. Activities of generation, transmission and distribution of electricity
Sales dynamics in the industry
Dynamics of gross profit margin
3.3. Activity on production and distribution of fuel gas
Sales dynamics in the industry
Dynamics of gross profit margin
4. ENERGY RESOURCES BALANCE
4.1. Structure of energy resource production by type
4.2. Energy resources consumption by industries
4.3. Share of energy losses
4.4. Fixed assets depreciation
5. ELECTRICITY CONSUMPTION AND PRODUCTION BALANCE IN RUSSIA
5.1. Amount and structure of electricity production
5.2. Russian electricity consumption structure by consumer groups
5.3. Production and structure of electricity consumption in RF regions
5.4. Regions with the maximum number of energy losses
5.5. Regions with the minimum number of energy losses
5.6. Deterioration of networks and equipment
6. ELECTRICITY CONSUMPTION IN RUSSIA
6.1. Dynamics of consumption by years
6.2. Electricity consumption by federal districts
6.3. Electricity consumption in regions of RF
7. FUEL ENERGY PRODUCTION
7.1. Fuel gas production and consumption balance
7.2. Gas sales structure by consumer groups
8. LARGEST POWER GENERATING COMPANIES
8.1. Gazprom Group
8.2. FGC UES
8.3. Inter RAO UES
8.4. Other companies
9. TARIFFS FOR ELECTRICITY AND GAS SUPPLY
9.1. Tariffs for gas supply
9.2. Tariffs for electricity supply
9.3. Tariff regulation
10. STATE REGULATION OF ENERGY MARKET
10.1. Laws and state programs
10.2. Results of the government program of energy efficiency
10.3. Installation of metering equipment
10.4. Prohibition on incandescent light bulbs
10.5. Public-private partnership in energy efficient lighting
10.6. Electric grid complex development strategy of the Russian Federation
Demand for energy-saving technologies in the public sector
11. FACTORS HINDERING THE MARKET DEVELOPMENT
12. PROFILES OF THE LARGEST COMPANIES
12.1. «Mosenergo» OJSC
Reference information
Types of activity
Balance sheet
Profit and loss statement
Cash flow statement
Financials of activity
12.2. «FGC UES» OJSC
Reference information
Types of activity
Balance sheet
Profit and loss statement
Cash flow statement
Financials of activity
12.3. «Inter RAO» OJSC
Reference information
Types of activity
Balance sheet
Profit and loss statement
Cash flow statement
Financials of activity
13. FORECAST OF ENERGY SAVING MARKET DEVELOPMENT FOR 2014-2016
13.1. Energy conservation in the electricity
Energy saving potential
Lighting in electricity consumption
The potential capacity of the Russian market
13.2. Energy conservation in the gas industry
Gas saving potential
13.3. Potential for energy savings in certain sectors of the economy
13.4. Potential of secondary energy resources
INFORMATION ABOUT INTESCO RESEARCH GROUP
Schedule 1. Population in Russia in 1990, 2000, 2005 and 2008-2012, ths. peop.
Schedule 2. Dynamics of the population size in Russia in 3 scenarios in 2011-2031, ths. peop.
Diagram 1. Structure of the population in Russia in relation to a working age in 2011-2031, % (medium scenario)
Table 1. Population of the largest Russian cities according to the National Census in 2002 and 2010 and by 1 September 2013, ths. peop.
Schedule 3. Dynamics of actual disposable money profit and its annual growth rate in 2000-2012, %
Schedule 4. Dynamics of demographic burden ratio in three scenarios in 2011-2031
Diagram 2. Dynamics of employed and unemployed population number in Russia in 2000-2012 and its forecast for 2013-2015, mln. people
Schedule 5. Dynamics of unemployed population number in economically active population by federal districts of RF in 2006-2012, %
Schedule 6. Dynamics of GDP in Russia in the prices of 2008 and 2002-2012 and its forecast for 2013-2015, bln. rub..
Schedule 7. Fixed capital investment in RF in 2002-2012 and its forecast for 2013-2015, bln. rub.
Schedule 8. Fulfilled consolidated budget surplus/deficit in RF in 2006-2012, % of GDP
Schedule 9. Dynamics of RF total external debt and its GDP share in 2009-2013 (as for 1st January), bln. USD.
Diagram 3. Changes in the structure of external debt of RF in 2009-2013(as for 1st January), %
Schedule 10. Dynamics of consumer price index in 2006-2012 and its forecast for 2013-2015, % by the same period in the previous years
Schedule 11. Dynamics of population in Russia and in the world in 2000-2012 and its forecast until 2100, bln. peop.
Schedule 12. RF share in the world GDP in 2001-2012 and its forecast for 2013-2016, %
Scheme 1. Methods of energy and energy material consumption
Schedule 13. Dynamics of index of production on type of economic activity «Production and distribution of electricity, gas and water» in 1992-2012, %
Schedule 14. Sales dynamics on type of economic activity «Production and distribution of electricity, gas and water» in RF in 2007-2013*, bln. rub.
Table 2. Sales result on type of economic activity «Production and distribution of electricity, gas and water» in RF regions in 2007-Sept 2013, bln. rub.
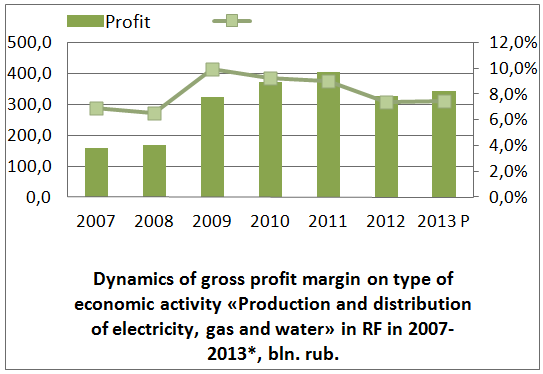
Schedule 15. Dynamics of gross profit margin on type of economic activity «Production and distribution of electricity, gas and water» in RF in 2007-2013*, bln. rub.
Table 3. Amount of profit on type of economic activity «Production and distribution of electricity, gas and water» in RF regions in 2007-Sept 2013, mln. rub.
Schedule 16. Sales dynamics on type of economic activity «Production and distribution of fuel gas» in RF in 2007-2013*, bln. rub..
Table 4. Sales result on type of economic activity «Production and distribution of fuel gas» in RF regions in 2007-Sept 2013, mln. rub
Schedule 17. Dynamics of gross profit margin on type of economic activity «Production and distribution of fuel gas» in RF in 2007-2013*, bln. rub..
Table 5. Amount of profit on type of economic activity «Production and distribution of fuel gas» in RF regions in 2007-Sept 2013, ths. rub.
Diagram 4. Structure of energy resources by types in 2011, %
Table 6. Energy resources balance in Russia in 2011, mln. tons c.e.
Diagram 5. Final consumption of main energy resources by industries in 2011, %
Table 7. Structure of energy resources distribution by consumption types in 2011, mln. tons c.e.
Schedule 18. Losses share at the stage of transportation and consumption by types of energy resources in 2011, %
Schedule 19. Degree of depreciation of the main funds in separate economy sectors in 2012, %
Schedule 20. Structure of electricity production in UES branches in Russia by types of generation in 2012, %
Schedule 21. Structure of electricity consumption in RF in 2011, %
Table 8. Electricity production and consumption balance in RF regions in 2011, mln. kWh
Schedule 22. Regions with the maximum number of energy losses in power networks in 2011, %
Schedule 23. Regions with the minimum number of energy losses in power networks in 2011, %
Schedule 24. Share of power networks which have fulfilled their standard period, %
Schedule 25. Dynamics of electricity consumption in 2008-2013*, trln. kWh
Table 9. Volumes of electricity consumption by federal districts of RF in 2008-2012, mln. kWh
Diagram 6. Structure of electricity consumption by federal districts of RF in 2012, %
Table 10. Volumes of electricity consumption in regions of RF in 2008-2012, mln. kWh
Diagram 7. Regional structure of electricity consumption in RF in в 2012, %
Diagram 8. Structure of produced gas by «Gazprom» Group by groups of consumers in 2011-2012, %
Table 11. Index of «Gazprom» Group activity for 2011-2012
Table 12. Index of «FGC UES» OJSC activity
Table 13. Index of «Inter RAO UES» activity in 2012
Table 14. The largest companies in terms of sales results on type of economic activity «Production, transmission and distribution of electricity» in 2012
Table 15. The largest companies in terms of sales results on type of economic activity «Production and distribution of fuel gas» in 2012
Table 16. Tariffs for supplying the population with pipeline gas in regions of RF in the 1st half a year of 2010-2013, rub.
Schedule 26. Tariffs for electricity in different types of houses by federal districts of RF in the 1st half a year of 2013, rub.
Table 17. Tariffs for supplying the population with electricity in houses with gas stoves in regions of RF in the 1st half a year in 2010-2013, rub.
Scheme 2. Legal regulation of the energy saving market in Russia
Schedule 27. Dynamics of competitive tenders and value procured on type of activity «Energy efficient lighting» in 2012
Diagram 9. Changes in the structure of tenders on type of activity «Efficient energy» by quarters of 2012, %
Diagram 10. Changes in the structure of value procured on type of activity «Efficient energy» by quarters of 2012, %
Scheme 3. Factors hindering the development of energy saving and energy efficiency in Russia
Table 18. Shareholders/founder members of «Mosenergo» OJSC
Table 19. Subsidiaries of «Mosenergo» OJSC
Table 20. Balance sheet of «Mosenergo» OJSC , ths. rub.
Table 21. Profit and loss statement of «Mosenergo» OJSC , ths. rub.
Table 22. Cash flow statement of «Mosenergo» OJSC , ths. rub.
Table 23. Dynamics of financial activity of «Mosenergo» OJSC
Table 24. Shareholders/founder members of «FGC UES» OJSC»
Table 25. Subsidiaries of «FGC UES» OJSC
Table 26. Balance sheet of «FGC UES» OJSC, ths. rub.
Table 27. Profit and loss statement of «FGC UES» OJSC, ths. rub.
Table 28. Cash flow statement of «FGC UES» OJSC, ths. rub.
Table 29. Dynamics of financial activity of «FGC UES» OJSC
Table 30. Shareholders/founder members of «Inter RAO» OJSC
Table 31. Subsidiaries of «Inter RAO» OJSC
Table 32. Balance sheet of «Inter RAO» OJSC, ths. rub.
Table 33. Profit and loss statement of «Inter RAO» OJSC, ths. rub.
Table 34. Cash flow statement of «Inter RAO» OJSC, ths. rub..
Table 35. Dynamics of financial activity of «Inter RAO» OJSC
Table 36. Forecast of Russian economy development for 2014-2016
Table 37. Forecast for prize of oil and gas for 2014-2016
Diagram 11. Energy saving potential in the Russian economy, %
Schedule 28. Dynamics of the demand for electricity in 2012-2013* and its forecast for 2014-2016, bln. kWh
Table 38. Volume of light points subject to modernization
Diagram 12. Gas saving potential in the Russian economy, %
Schedule 29. Dynamics of production and domestic consumption of natural gas in Russia in 2010-2013*, and its forecast for 2014-2016, bln. m3
Готовую работу Вы можете заказать по телефону +7 (495) 212-91-91
или оставить заявку на сайте, после чего с Вами свяжется наш менеджер.
Также Вы можете заказать разработку бизнес-плана для Вашего собственного проекта


